Best Order Block Indicator for TradingView: A Buyer's Checklist
Quick answer: The best order block indicator on TradingView is the one that draws fewer zones, not more. A useful order block indicator only creates a zone after price breaks market structure, removes the zone once price has used it, and gives you alerts and a clear way to frame the stop. If a tool cannot tell you why a zone exists and when it stops being valid, it will clutter your chart instead of helping you trade it.
This guide explains what an order block is, gives you a concrete checklist for judging any order block indicator, shows how to test one on your own chart before you rely on it, and lists the mistakes that make most order block charts unreadable. At the end, we map the ZynAlgo TradingView tools that fit each point on the checklist.
What an order block is, in plain terms
An order block is the last opposite-direction candle before price moves away from an area with force and breaks a swing level. In a bullish case, it is usually the last down candle before a strong move up that closes above a prior swing high. In a bearish case, it is the last up candle before a strong move down that closes below a prior swing low.
That candle marks where the move started, so price often comes back to it before continuing or failing. Smart Money Concepts and ICT traders watch these zones for a retest and a reaction.
The problem is that almost any strong candle looks like an order block after the fact. Mark them by hand for a week and your chart fills with rectangles that never matter. Filtering those out is the real job of an order block indicator.
The order block indicator checklist
Use these eight points to judge any order block indicator on TradingView. They are listed roughly in order of importance.
1. Structure-break confirmation
A zone should only be created when price has actually broken a swing level, usually labelled as a break of structure (BOS) or change of character (CHoCH). Without that rule, the indicator marks every pause in price as a zone. Look for settings that control how strong the break must be, such as a minimum candle body or a minimum range measured against ATR (average true range, a measure of typical candle size).
2. Clear mitigation and removal rules
Mitigation means price has come back into the zone and used it. A good indicator tells you exactly when that happens and what it does next. Common rules are removing the zone when price trades through its midpoint, or when a candle closes beyond its far edge. Ideally you can choose between a close-based rule and a wick-based rule. A zone that stays on the chart forever after price has traded deep inside it is no longer information.
3. A limit on how many zones stay live
Check whether you can cap active zones per side and whether near-duplicate zones are rejected.
4. Closed-bar confirmation
Zones and markers should be created on confirmed bars, so what you see on a closed candle is what the indicator decided on that candle. Ask the vendor how the tool handles the live, unfinished bar, and read the manual for the exact rule.
5. Multi-timeframe context
An order block on a 5-minute chart means more when the higher timeframe agrees. Some indicators show higher-timeframe zones on a lower chart; others leave this to a separate bias tool. Either works, as long as you can check the bigger picture.
6. Alerts you can actually use
Look for alert conditions tied to specific events, such as a new zone forming, price returning to a zone, or a confirmed signal printing.
7. Stop and target framing
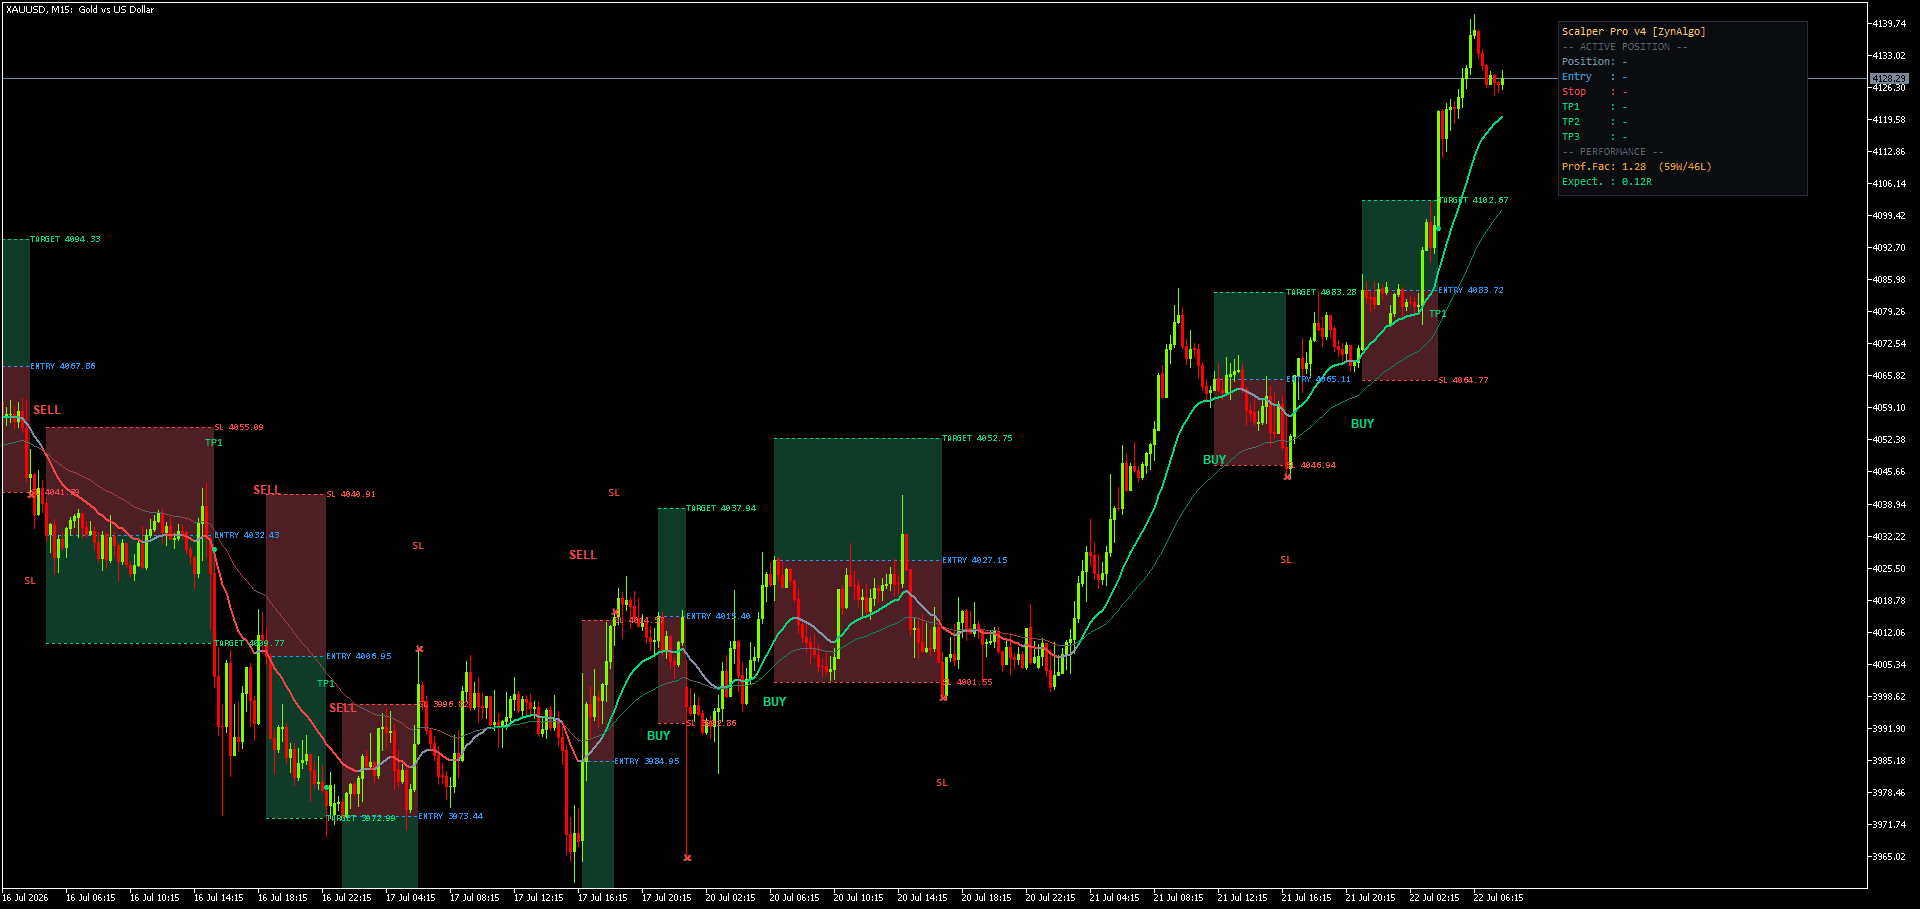
Some order block indicators are pure context: they draw zones and leave the trade to you. Others print a signal and frame it with an entry reference, a stop and measured targets. Neither is better in general, but you should know which one you are buying. If a tool does frame trades, check how the stop is placed (for example, an ATR-based distance) and whether targets are set as multiples of risk.
8. Volume inside the zone, and a clean chart
A standard order block is one flat rectangle, as if every price inside it mattered equally. Tools that read lower-timeframe volume can show where inside the zone the volume actually sat. Finally, check the visual side: adjustable colours, labels you can turn off, and no stacked duplicates. If you cannot read price through the indicator, it is not helping.
STAT-ARB Pro TDV
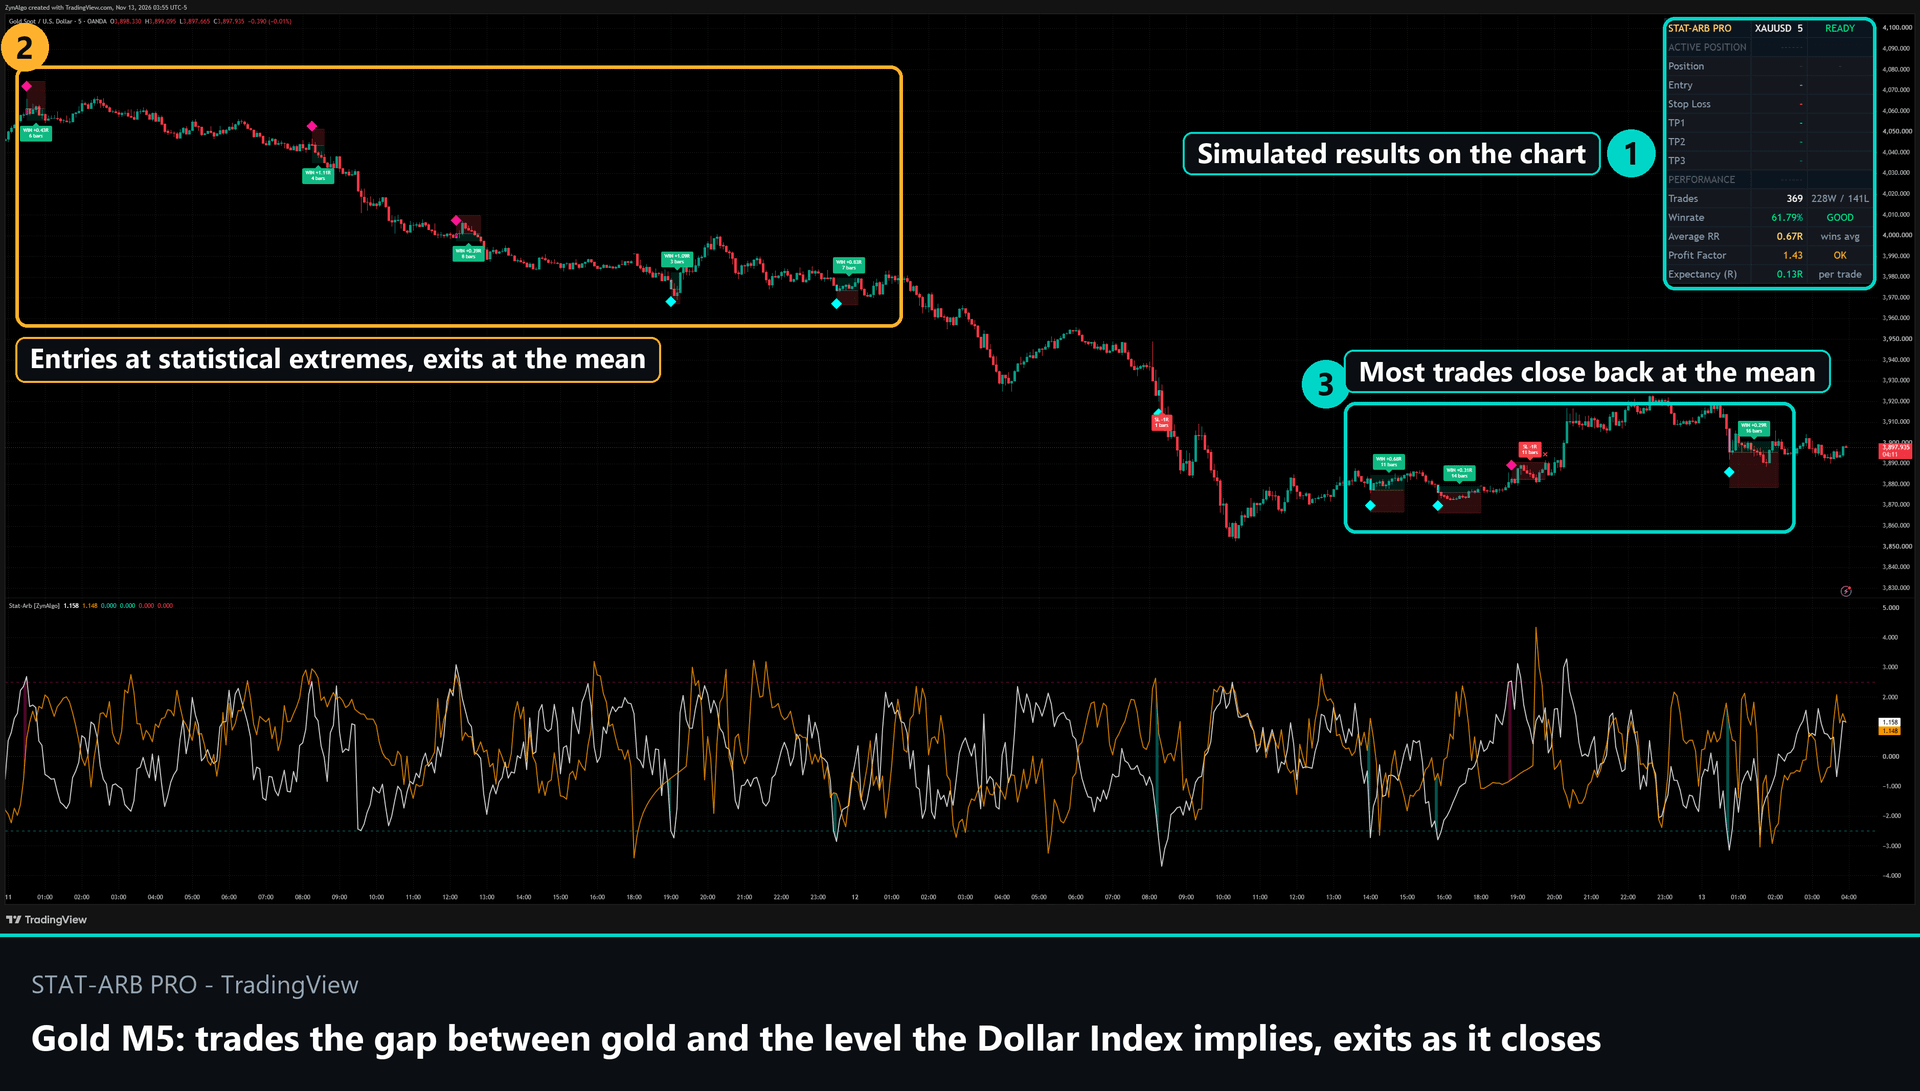
Trades gold's deviation from the level the Dollar Index implies and exits as the gap closes. Rolling regression spread, Auto preset for M5 and M15, closed-candle signals with a stop and a mean exit.

How to test an order block indicator on your own chart
Before trusting any indicator, spend an hour checking it on the market and timeframe you actually trade. Here is a simple process.
- Pick one market and one timeframe. For example, gold on the 15-minute chart.
- Scroll back and replay. Use TradingView's Bar Replay to step through past sessions candle by candle. Watch when each zone appears and confirm it appears on a closed bar after a real structure break.
- Count zones per session. Write down how many zones were created and how many price actually returned to. If the chart is full of zones that price never revisited, tighten the settings or move on.
- Check the removal rule. Find three zones that price traded through. Confirm each one was removed or marked as used the way the manual says.
- Test the alerts. Set one alert on a live chart and confirm it fires on the event you expect, with a message you can read quickly.
- Compare against the higher timeframe. Note whether the zones that worked tended to line up with the higher-timeframe direction. This tells you whether you need a separate bias filter.
Common mistakes with order block indicators
- Treating every zone as a trade. A zone is a place to watch, not an instruction. Wait for price to return and react.
- Keeping used zones alive. Once price has traded through the middle of a zone, the original reason for it is mostly gone.
- Chasing the break. The structure break creates the zone. The trade idea usually comes later, on the retest.
- Ignoring the higher timeframe. Bullish zones on a lower chart inside a strong higher-timeframe downtrend deserve extra caution.
- Stacking several zone indicators. Overlapping boxes from three tools make the chart harder to read. Pick one primary zone tool.
ZynAlgo order block indicators for TradingView, mapped to the checklist
ZynAlgo builds several TradingView tools around order blocks. Each one is sold as a one-time purchase with lifetime access, delivered as an invite-only script added to your TradingView username. They do different jobs, so the right one depends on whether you want context, signals or volume detail.
ICT SMC TDV: zones only from real structure breaks
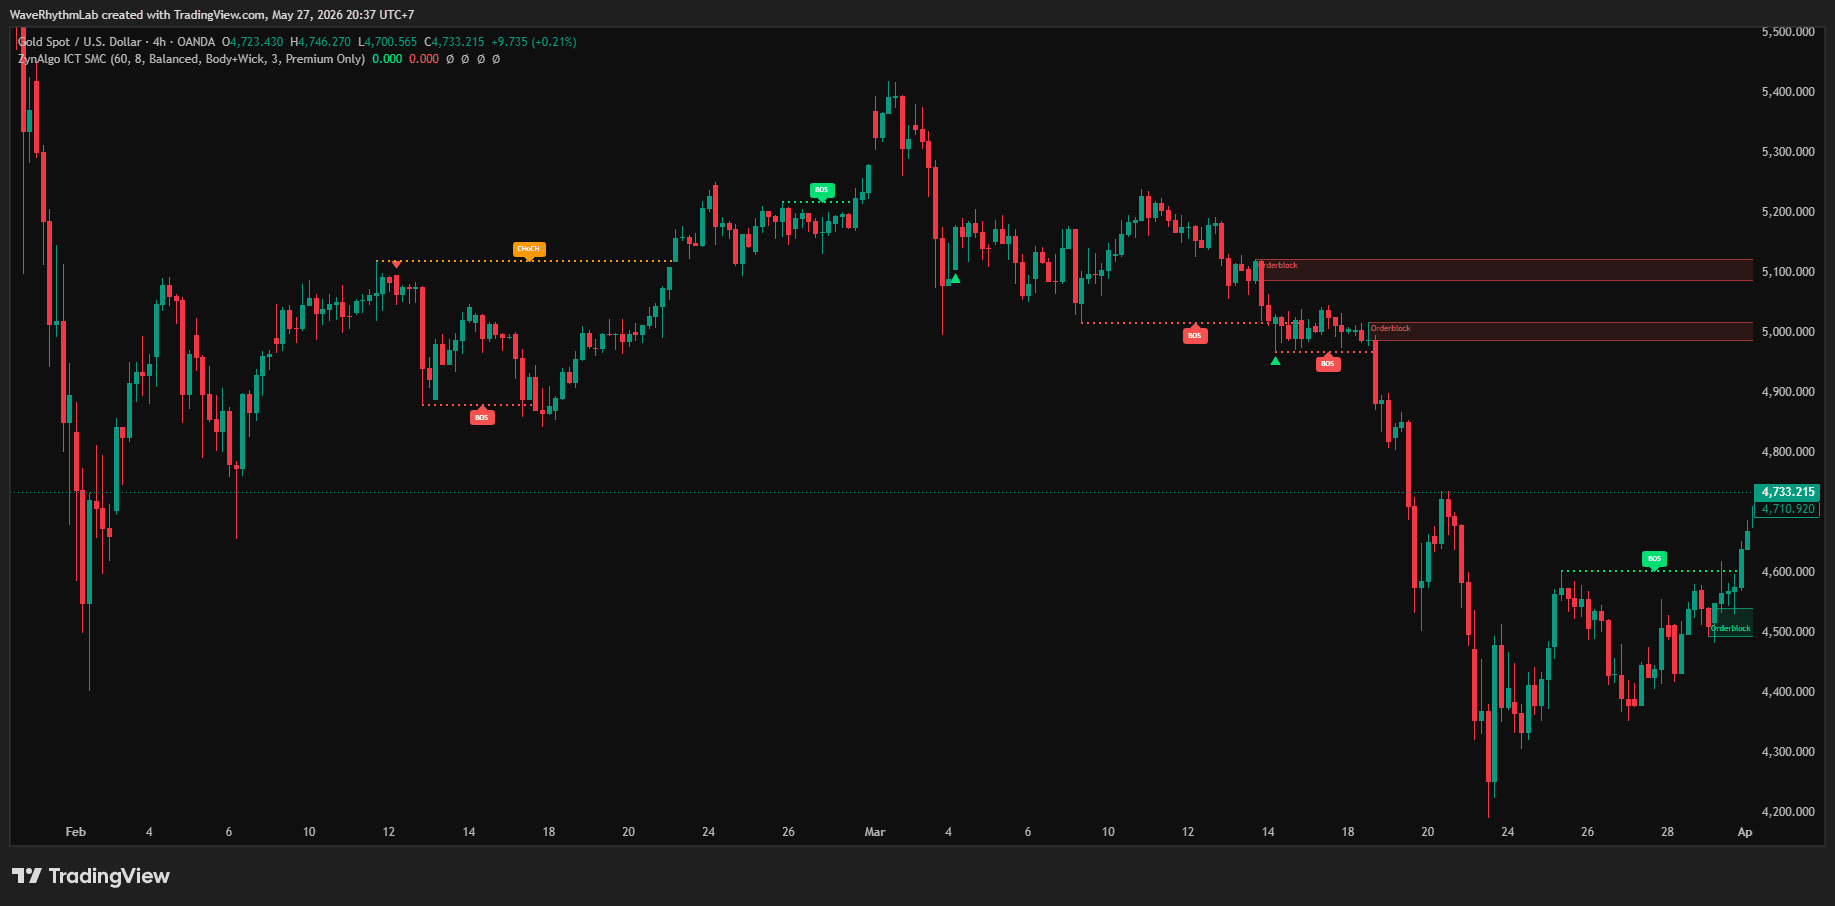
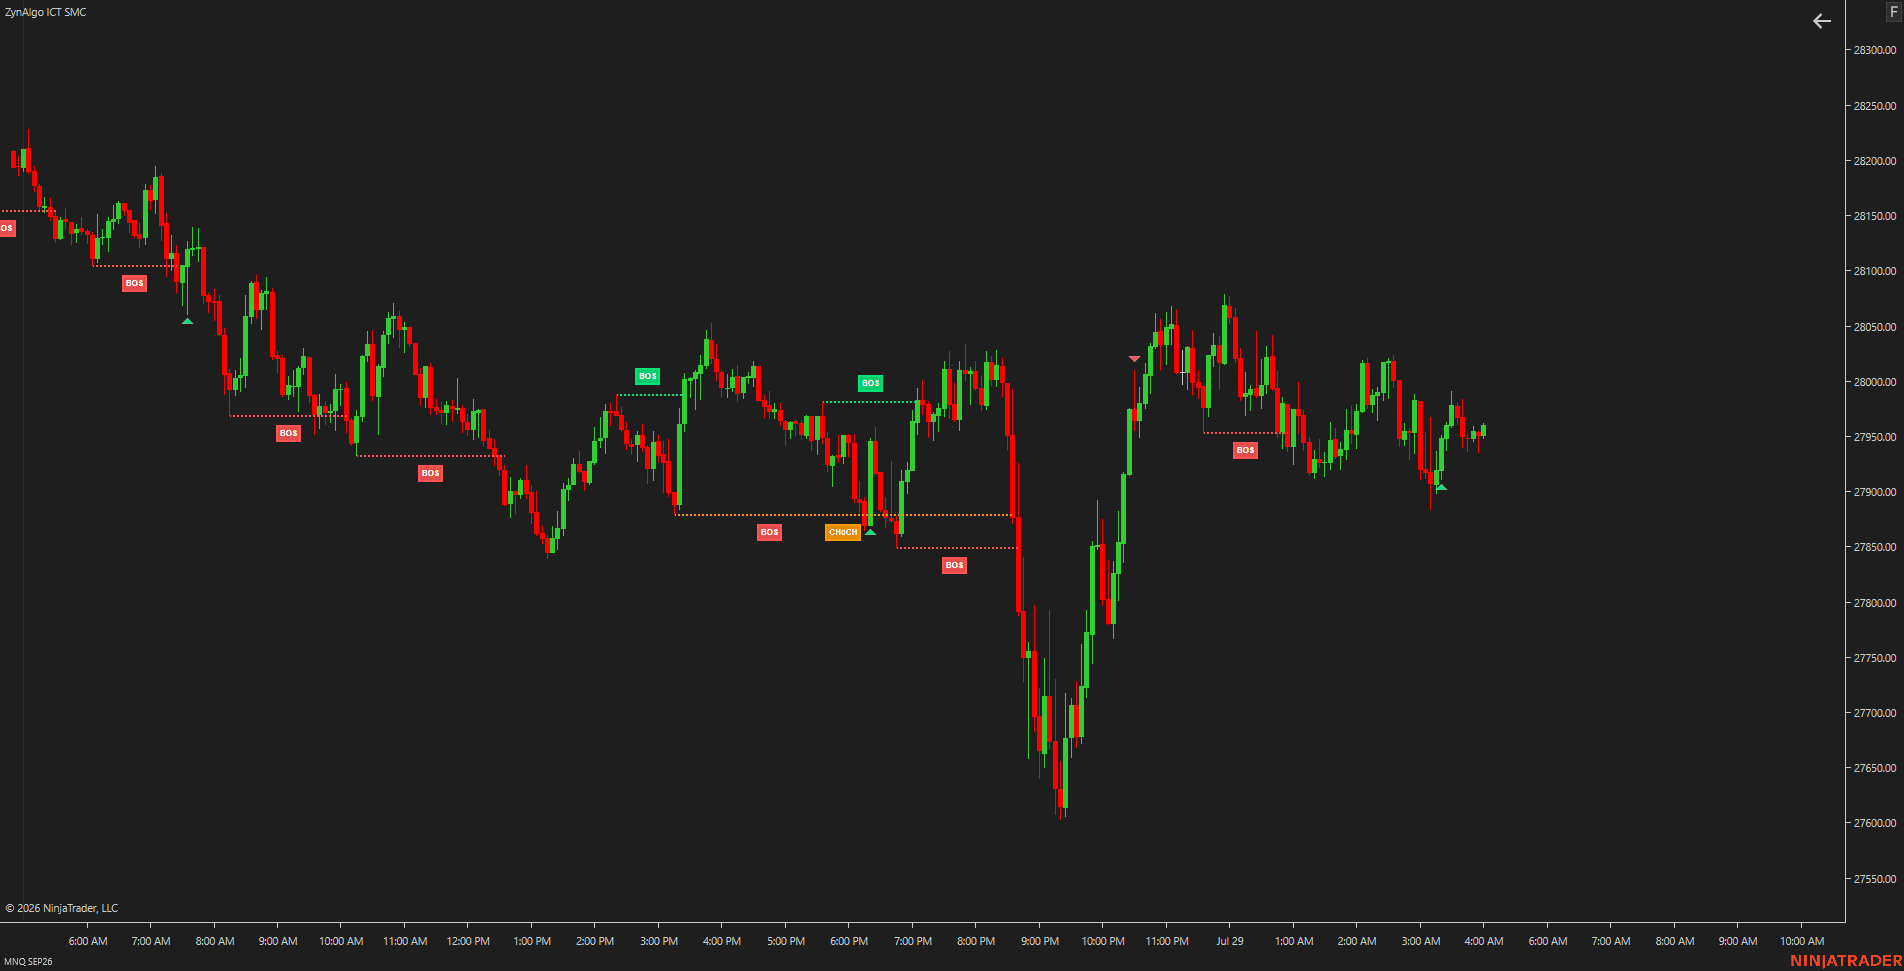
ICT SMC TDV is a chart-mapping tool. It covers the first three points of the checklist directly.
- Structure-break confirmation: a zone is only created after a BOS or CHoCH fires. The breaking candle needs a body of at least 45% of its range and a range of at least 0.60 ATR. An OB Strictness input (Strict, Balanced or Loose) decides whether a fair value gap or a strong displacement candle must follow the origin candle.
- Mitigation and removal: zones are deleted once price reaches their 50% midline or closes decisively beyond it.
- Zone limit: Max Zones Per Side defaults to three, and overlapping or near-identical zones are rejected.
- Structure labels: BOS, CHoCH and buy-side or sell-side liquidity sweeps are labelled where they happen.
- Clean chart: price action markers (pin bar, engulfing, inside-bar break, rejection wick) only print near a zone, a swing or a failed break in the default mode, and are spaced at least 8 bars apart.
What it does not do: ICT SMC TDV has no entry signals, no alerts and no trade dashboard. It is built for traders who want qualified zones and make their own decisions on stops and targets.
ICT Propulsion Block TDV: signals on stacked order blocks
ICT Propulsion Block TDV covers the signal side of the checklist. It maps order blocks from confirmed swing breaks, then only signals when a new block forms stacked on the previous one in the same direction, which it calls a propulsion block. We explain that pattern in detail in Which Order Block Is Worth Trading?
- Mitigation rules you choose: Mitigation Price Type sets whether a block counts as mitigated on a close past it or on a wick touch.
- Housekeeping: options remove blocks that never led to a propulsion, clear mitigated blocks, and cap how many recent blocks stay drawn.
- Closed-bar signals: the propulsion signal is evaluated on the closed bar and marked with a diamond.
- Stop and target framing: each signal uses the signal bar's close as the entry reference, an ATR-scaled stop, and up to three targets at the risk-to-reward ratios you set, with a move to break-even after the first target when another target is still open.
- Alerts: bullish and bearish propulsion each have their own alert condition.
- Session window: an optional UTC time filter keeps signals inside the hours you trade.
Micro-Profile TDV: volume inside each order block
Micro-Profile TDV covers point eight. It splits each order block into ten price grids by default and fills them with lower-timeframe volume, drawn as a horizontal histogram inside the box.
- Point of Control: the grid with the most volume is drawn solid, and its price is printed on the block's label along with direction and total volume.
- Lower-timeframe data chosen for you: for example, 3- to 15-minute charts pull one-minute data, and 30- and 60-minute charts pull five-minute data.
- Confirmed bars only: blocks are created on confirmed bars.
- One marker per block: a diamond prints when price returns to a block, each block signals once by default, and a five-bar cooldown applies across all blocks.
- Removal rule: a block is removed when price closes through its far side.
It fits best on markets with real volume, such as futures, indices, gold and crypto. On thin instruments or long chart timeframes, the lower-timeframe history TradingView can supply runs out and the profile has less to work with.
S&R Pro TDV: where liquidity rests around the zones
S&R Pro TDV marks confirmed swing highs and lows from closed bars and draws liquidity lines beyond them. The newest buy-side and sell-side lines extend to the current bar, and four alerts cover new swings and price reaching either liquidity side. Used with a zone tool, it helps you see whether a move into an order block first swept nearby liquidity.
Covering multi-timeframe context
None of the three order block tools above is built as a multi-timeframe dashboard. If you want that check in one place, MTF Command Center TDV runs the same structure engine across up to seven timeframes and shows the results as a weighted-bias table.
Which one should you start with?
Want qualified zones and your own trade decisions: ICT SMC TDV. Want a framed signal with alerts: ICT Propulsion Block TDV. Want to see where the volume sat inside a zone: add Micro-Profile TDV. Every product page has a full Description and Manual, so you can check each definition before you buy. If you want to try ZynAlgo tools first, see the free indicators, or browse the full marketplace.
FAQ
What is the best order block indicator on TradingView?
There is no single best tool for every trader. The best order block indicator for you creates zones only after a confirmed structure break, removes zones once price has used them, limits how many zones stay on the chart, and offers alerts. Test any candidate with Bar Replay on your own market and timeframe before relying on it.
How do you know if an order block is still valid?
Most methods treat a zone as used once price has traded through its midpoint or closed beyond its far edge. A good indicator applies that rule for you and removes or marks the zone, so you only watch fresh zones.
Do order block indicators give buy and sell signals?
Some do and some do not. Context tools, such as ICT SMC TDV, draw zones and structure labels only. Signal tools, such as ICT Propulsion Block TDV, print a marker on a specific condition and frame the trade with an entry reference, stop and targets.
What timeframe works best for order blocks?
Order blocks can be read on any timeframe, but the settings should match it. Many intraday traders work on 5-minute to 1-hour charts and check a higher timeframe for direction. Shorter swing lengths produce more zones, so lower timeframes usually need stricter settings.
What is the difference between an order block and a supply or demand zone?
The two ideas overlap. An order block is usually defined from one specific candle, the last opposite candle before a structure break. A supply or demand zone is often a broader area where price based before a strong move. Many traders use both terms for similar areas; what matters is the indicator's exact rule.
Trading involves risk; indicators support decisions, they do not guarantee results.
STAT-ARB Pro TDV
Trades gold's deviation from the level the Dollar Index implies and exits as the gap closes. Rolling regression spread, Auto preset for M5 and M15, closed-candle signals with a stop and a mean exit.