False RSI Reversal Signals in a Downtrend: Why They Happen on MT5
You watch RSI on EURUSD H1 drop under 30, take the long because it feels overdue for a bounce, and price keeps sliding for another 40 pips before it even pauses. False RSI reversal signals in a downtrend are one of the most common ways a mean-reversion trade gets flattened: the indicator says oversold, but the market is simply still trending down, and oversold in a trend usually just means the trend is working.
Why false RSI reversal signals happen in a downtrend
RSI on its own has no idea whether the market is trending or ranging. It measures the speed and change of recent price moves, nothing else. In a strong downtrend, RSI can sit under 30 for dozens of bars in a row, turning up briefly on every small bounce and then rolling back over as the trend resumes. Each of those small turns looks identical to a real reversal on the RSI pane alone. The only way to tell them apart is to bring in a second read on the market: is price actually flattening out, or is it still making progress in one direction.
What Trendline v5.0 does
Trendline v5.0 is an MT5 indicator built specifically to answer that second question before it acts on RSI at all. Its default engine, Mode 4, runs a stepped, range-based moving average (the Sentiment Range MA) that classifies the market as rising, falling or flat, and colours your candles to match: green for up, red for down, yellow for flat. A BUY signal in Mode 4 only prints when all of these line up on the same bar:
- The prior bar's RSI closed below its oversold level and was still falling versus two bars back
- The current RSI has turned back up above the previous bar's value
- Price is sitting in the bottom portion of the last 50 bars' range
- The Sentiment Range MA is flat (candles are yellow), not falling
- A cooldown since the last signal has cleared
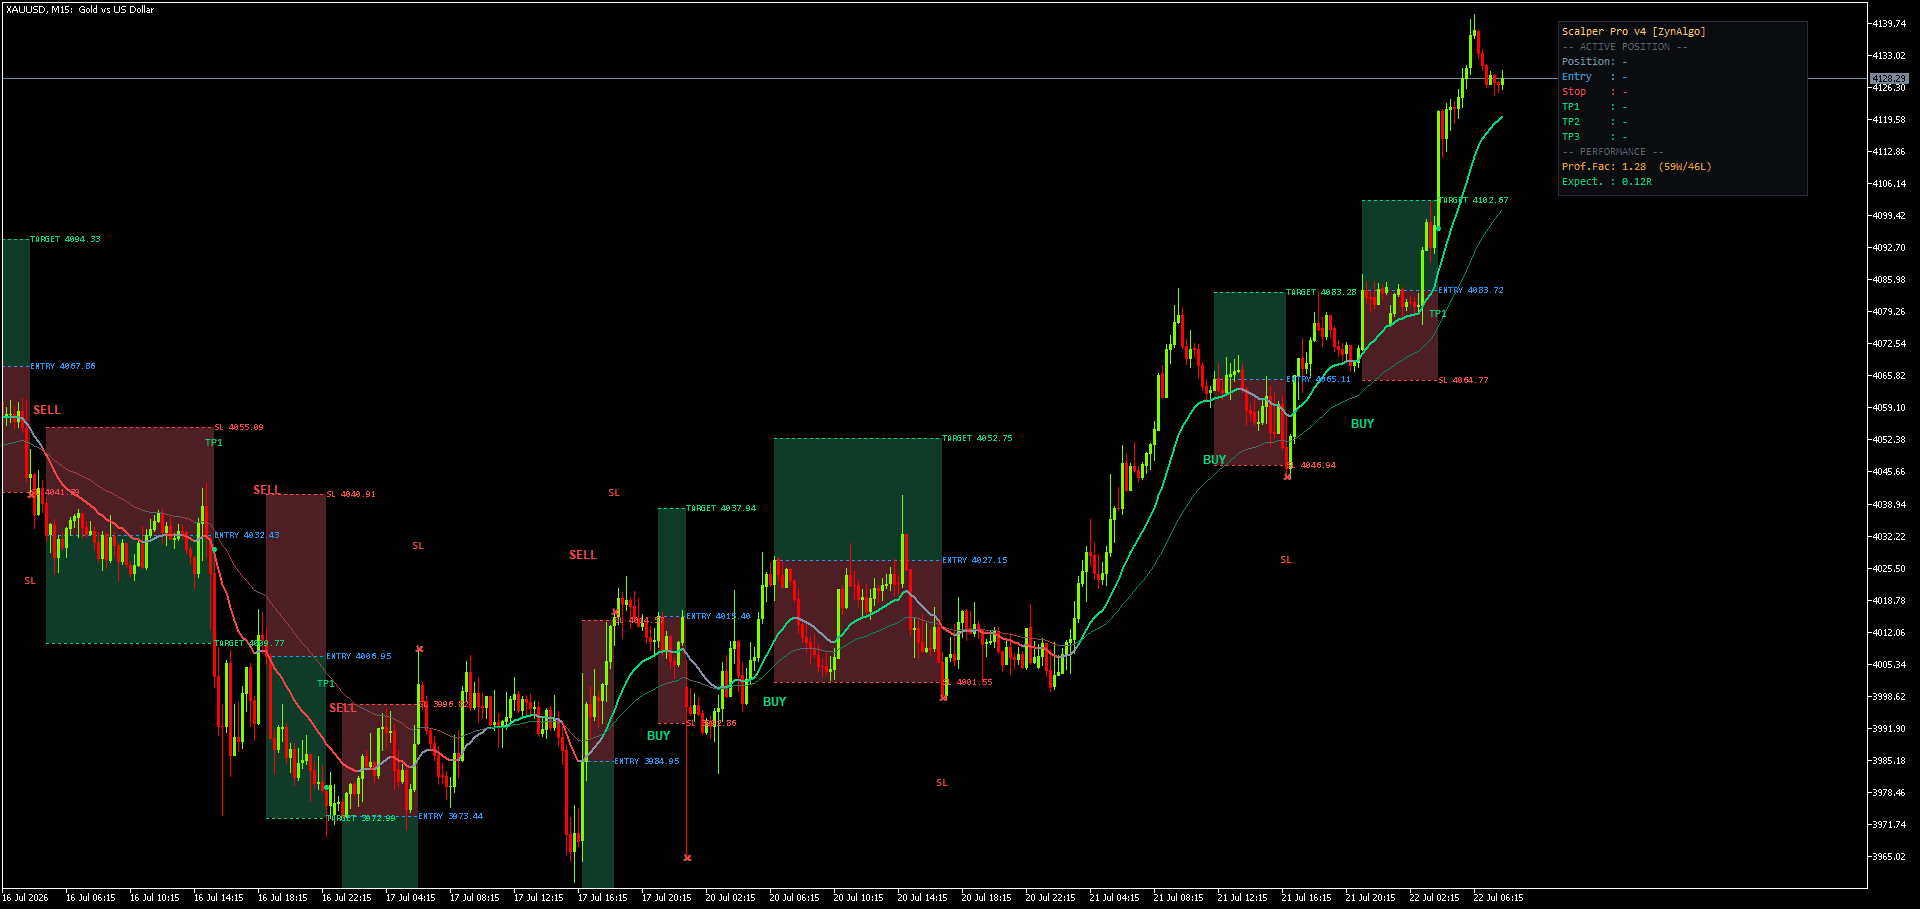
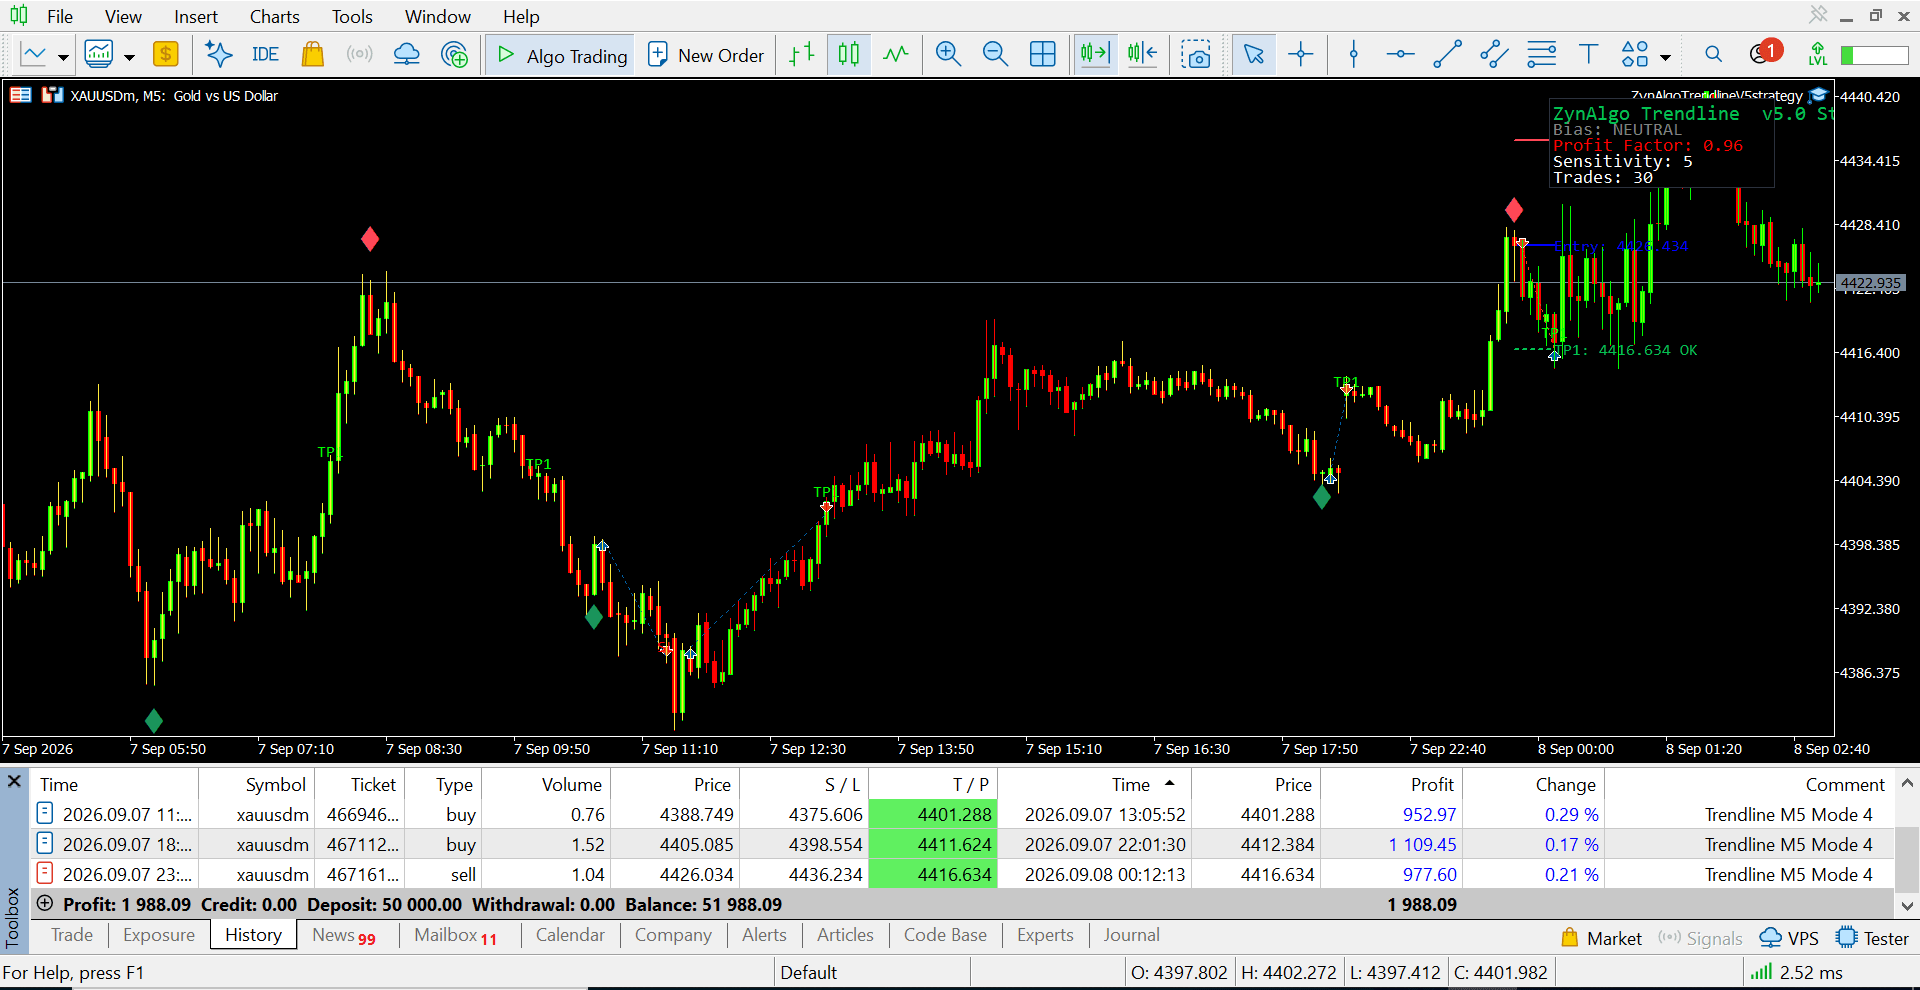
A SELL is the mirror image at the top of the range. Because the flat-average condition is required, Trendline v5.0 simply will not print a Mode 4 signal while the average is still falling, which is exactly the condition that produces the false reversal reads described above. Every signal that does print comes with a full plan drawn on the chart: a green reward box to the target, a red risk box to the stop (set at 2.8x ATR(14) by default), and a WIN, TP or SL result label once the setup closes.
For traders who want to read with the trend instead, the same indicator ships three other engines: Mode 1 (pullback onto a stacked EMA set), Mode 2 (the bar three EMAs first stack in order) and Mode 3 (a fast/slow RSI crossover).
Trendline v5.0 MT5
Draws reversal entry, stop and target boxes when price turns at the edge of a range, and colors candles to show whether the market is trending or flat.

Reading it in a real session
Picture gold on the H1 chart during a quiet Tuesday London session, drifting between two levels for six or seven hours. The candles turn yellow as the Sentiment Range MA flattens out, a visual cue that the range condition is met. RSI dips under 30, then on the next bar turns back above the prior bar's reading, and price is sitting in the lower part of the last 50 bars. That is the moment Trendline v5.0 prints a BUY marker below the bar, with the entry line at the bar's close, the stop drawn below it, and a green box up to the 1R target. If price keeps running, small dots mark each interim target as it is passed. If the stop is hit instead, the box is stamped SL -1R. Either way, the plan was visible the moment the signal appeared, not decided in the moment.
Who this fits
- You trade ranges and reversals rather than chasing breakouts
- You work intraday to swing timeframes, M15 through H4 is the natural home for the default settings
- You trade liquid instruments that spend real time going sideways: FX majors, gold, index CFDs, large-cap crypto
- You want a defined stop and target drawn on every signal instead of deciding levels on the fly
- You'd rather wait for a handful of well-located setups than act on every oversold reading
What it does not do
Trendline v5.0's default mode is deliberately quiet, and that has real costs. It does not predict how far a range will extend or when it will break, and once the Sentiment Range MA turns and starts trending, Mode 4 stops signalling entirely, by design. It does not tell you which direction a range will eventually resolve into once it breaks. If you are a pure trend-follower who wants to be positioned for every move, the default mode will feel too quiet for you, Modes 1 to 3 exist for that reading style instead but work differently and are not the focus here. Turning on the optional Follow Trend filter actively works against Mode 4's mean-reversion logic, so combining them undermines the tool's own purpose. And like any chart-based tool, none of this removes the need for your own risk decisions.
Trading involves risk, and nothing in this article is investment advice. Signals from Trendline v5.0, or any indicator, are analytical tools, not a prediction of what price will do next, and past chart behaviour does not guarantee future results.
How it pairs with other tools
Trendline v5.0 is built for range conditions specifically, so it naturally leaves gaps at the edges of that job. If scheduled news releases keep distorting the ranges you're watching before a setup can complete, News Sweep Sentinel MT5 is built around reading the sweep-and-reclaim pattern that often follows those spikes. And once a range does resolve into a genuine trend, that is outside what Mode 4 is trying to do at all, CHOP Trend Reentry Signal MT5 is built specifically for reading trend continuation once the choppy phase has ended. Each covers a different part of the cycle; neither is required to use Trendline v5.0 on its own.
If you keep getting stopped out on RSI extremes during what turns out to be a trend, not a range, Trendline v5.0 is worth a closer look on the ZynAlgo marketplace.
Trendline v5.0 MT5
Draws reversal entry, stop and target boxes when price turns at the edge of a range, and colors candles to show whether the market is trending or flat.