How to Avoid RSI Oversold Signals in a Downtrend (MT4)
The oversold trap on a falling chart
You are watching EURUSD on the H1 chart. Price has been sliding for two days. RSI drops under 30, then ticks back up on the next bar. It looks exactly like the textbook reversal setup you have been taught to spot. You buy. Three bars later the slide resumes and your stop is hit.
Nothing was wrong with your RSI reading. The problem is the chart it appeared on.
Why an oversold reading does not mean what it feels like it means
In a strong downtrend, RSI can sit near oversold levels for long stretches while price keeps making new lows. Every small tick up looks like a turn. Most of them are not. The trend has not run out of energy, it is just breathing. Taking a reversal entry there means fighting the dominant move with a signal that was only ever designed to work when the market has stopped trending.
The real question is not "is RSI oversold." It is "has this market actually stopped going anywhere." Those are two different questions, and mixing them up is how a mechanically correct reversal entry ends up on the wrong side of a trend.
How Trendline v5.0 separates the two questions
Trendline v5.0 is an MT4 indicator built to answer the second question before it ever looks at the first. Its default engine (Mode 4) runs a stepped, range-based moving average that classifies the market as rising, falling, or flat, and paints your candles to match: green for a rising average, red for a falling one, yellow when the average is flat. Because the average only re-centres once price pushes outside an ATR-sized band, its slope is a cleaner read on genuine direction than watching price bar by bar.
A BUY only prints when RSI closed below its oversold level, that reading was lower than two bars earlier, RSI has now turned back up, price sits in the bottom portion of the last 50 bars' range, and the candles are yellow, meaning the average is flat, not falling. A SELL mirrors this on the other side. If the average is still red or green, in other words the market is still trending, Mode 4 stays silent no matter how oversold or overbought RSI gets.
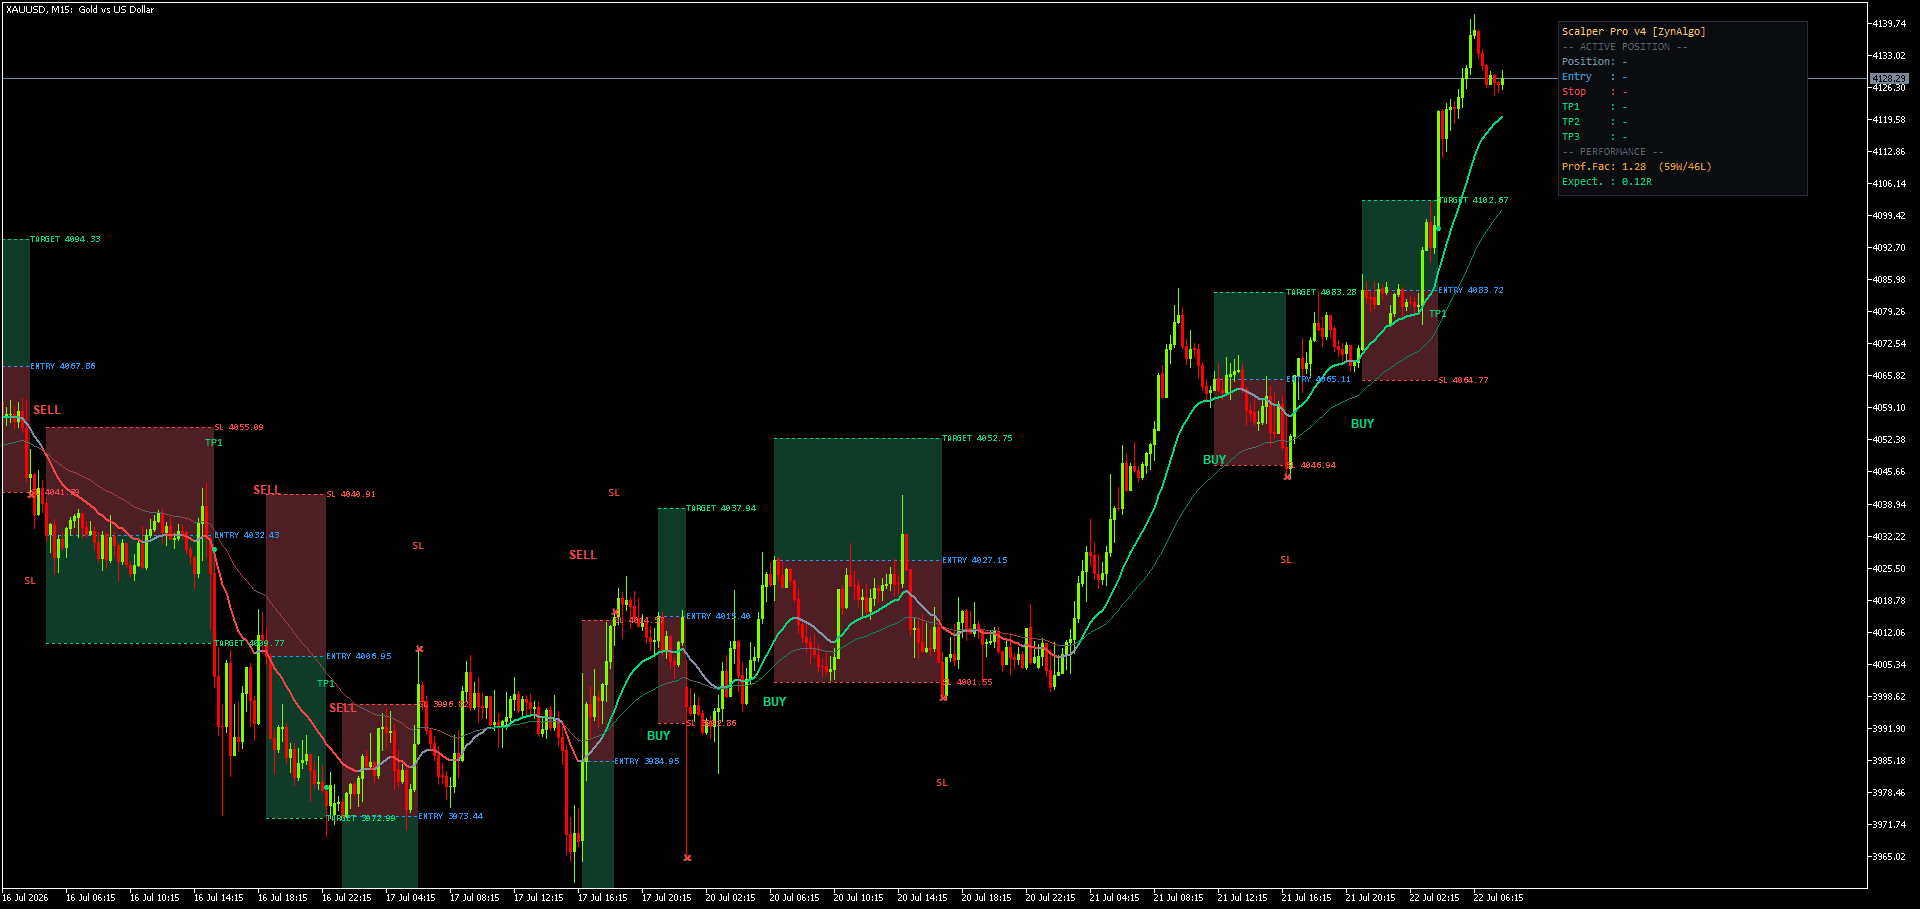
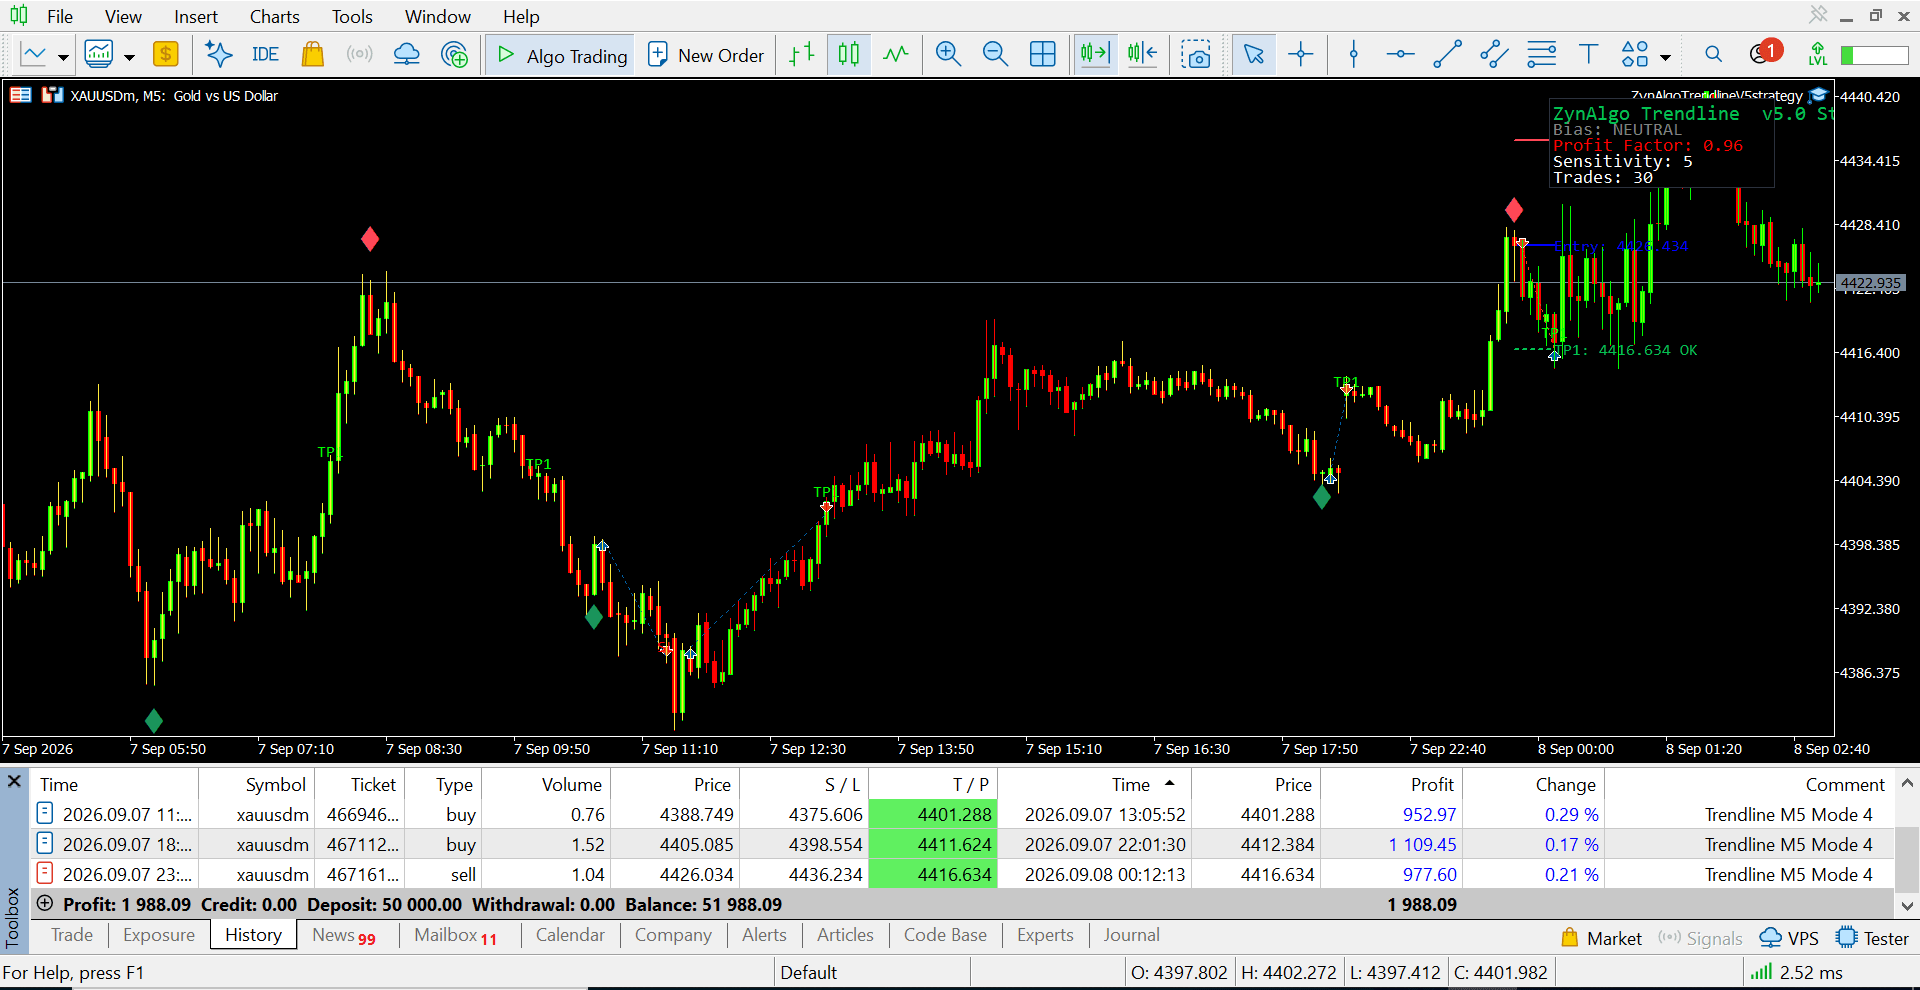
When a signal does fire, it draws the full plan on the chart: a green reward box from entry to target, a red risk box from entry to an ATR(14)-based stop, a dotted entry line, and a result label once the setup closes (a win at target, a partial close at an interim target, or a stop-out). You are not just told a reversal might be starting, you see the exact level it invalidates at.
A session example
Picture a gold (XAUUSD) M30 chart drifting inside a 40-pip band for six hours after a trending morning. Under Mode 4, the candles turn yellow as soon as that range behavior takes over, and RSI is then allowed to trigger a signal once it turns up from the lower part of the range. During the trending move that preceded it, the same oversold dips on RSI never printed a signal at all, because the candles were still red.
Who this fits
Trendline v5.0 is built for traders who:
- Trade ranges and reversals, not breakouts
- Work M15 through H4, where the default settings are tuned
- Trade instruments that genuinely chop, such as FX majors, gold, index CFDs, or large-cap crypto
- Want a stop and target already drawn instead of deciding levels in the moment
- Prefer fewer, better-placed signals over an arrow on every RSI extreme
If you want to be in every trending move, the quiet stretches will feel like the tool is missing opportunities. That is by design in Mode 4. The indicator also ships three trend-following engines (Mode 1, 2, and 3) for traders who would rather read pullbacks and EMA stacks than ranges.
Trendline v5.0 MT4
Draw reversal signals with ATR-based stops and profit targets only when price is range-bound on MetaTrader 4.

What it does not do
Trendline v5.0 does not predict when a trend will end or how far a range will extend. It classifies what the market has already done, using price and RSI, and gates signals accordingly. It cannot tell you the range will hold before it prints a signal, only that current conditions match its flat-market criteria.
It will underperform, or simply stay quiet, in genuinely strong trends and around high-impact news spikes, where price can push outside the recent range without ever settling into the sideways behavior the tool is looking for. The cooldown and optional filters (Stability Mode, Smart Signal Filter, session window) reduce signal count further, which means fewer opportunities during already-thin trading windows. It is also not a substitute for your own risk sizing: the drawn boxes show where the stop and targets sit, they do not size the position for you.
Pairing it with the rest of your setup
Because Mode 4 deliberately goes quiet during real trends, some traders run a trend-following tool alongside it for the periods Trendline v5.0 is sitting out, such as Delta Proxy Trend Pullback MT4. If your reversal setups keep getting caught out by news-driven spikes rather than genuine range behavior, News Sweep Sentinel MT4 is built specifically to flag those windows so you can see why a range looked real but was not.
Trading involves risk. Nothing in this article is financial advice, and no indicator, including Trendline v5.0, predicts future price behavior or removes the risk of a losing trade. Signals are an analytical tool for reading current conditions, not a guarantee of any outcome.
If recognizing a real range instead of guessing at trend exhaustion is the piece you are missing, the Trendline v5.0 listing has the full manual and every input explained before you decide.
Trendline v5.0 MT4
Draw reversal signals with ATR-based stops and profit targets only when price is range-bound on MetaTrader 4.