Volume Imbalance Indicator: What It Measures and How to Trade It on TradingView
Quick answer: a volume imbalance indicator shows where buying and selling activity was lopsided, either inside a candle, at a price level, or across a session. On TradingView, an intrabar volume imbalance indicator pulls the lower-timeframe bars inside each candle and measures how much volume traded in the upper half of the range versus the lower half, giving one percentage per candle. A strong reading at a meaningful level, such as a session point of control, is more useful than the reading on its own.
The phrase "volume imbalance" is used for three different things, and mixing them up is the most common reason traders pick the wrong tool. This guide explains each one, how to read an intrabar volume imbalance on TradingView, how to trade it, the mistakes to avoid, and how one indicator combines the reading with session levels.
Three meanings of "volume imbalance"
1. Volume imbalance as a price gap between candle bodies
In ICT-style price action, a volume imbalance is a spot where two consecutive candles' bodies do not overlap, even though their wicks do. The gap between one candle's close and the next candle's open marks a price area that traded very quickly. Traders watch these gaps as places price may revisit. This is a pattern in candle bodies; it does not measure volume at all.
2. Order flow imbalance at a price level
On a footprint chart, an imbalance compares aggressive buying at one price with aggressive selling at the adjacent price. When one side outweighs the other by a set ratio (3:1 is a common choice), that level is flagged. Stacked imbalances over several levels are read as strong initiative from one side. This needs bid and ask volume per price level.
3. Intrabar volume imbalance inside a candle
This asks a simpler question: inside this candle, did most of the volume trade near the high or near the low? It is built from lower-timeframe bars rather than individual trades, which makes it practical on a normal TradingView chart. This is the meaning this article focuses on.
Why a candle hides where its volume traded

A candle gives you four prices: open, high, low and close. Two candles with identical values can be built from very different volume. In one, most of the volume traded while price sat in the top half of the range. In the other, heavy volume traded near the lows and the close was reached on thin volume late in the bar.
The first candle shows buyers doing business at higher prices. The second shows a lot of activity at lower prices that the close does not reflect. They look the same on the chart and can behave very differently on the next few bars. An intrabar volume imbalance reading tells them apart.
Intrabar DOM Imbalance TDV
Reads intrabar volume distribution and prints session-anchored BUY/SELL signals on TradingView when imbalance, candle shape and POC retest agree.

How a volume imbalance indicator reads each candle
The calculation is straightforward:
- Split the chart candle into lower-timeframe bars, for example 1-minute bars inside a 15-minute candle.
- Find the candle's midpoint: (high + low) / 2.
- Add the volume of every lower-timeframe bar that closed at or above the midpoint to the upper half, and the rest to the lower half.
- Imbalance % = (upper volume minus lower volume) / total volume x 100.
A reading of +100 means all volume traded in the top half; -100 means all of it traded in the bottom half; near zero means it was spread evenly. A threshold, for example 20%, separates candles worth noticing from ordinary ones.
Agreement and disagreement
- Agreement (momentum): a strong bullish candle with a high positive imbalance. Volume pushed with the move.
- Disagreement (absorption): a bearish candle with a high positive imbalance, or the reverse. Heavy volume traded at one end of the bar but failed to move the close that way. One side was absorbing the other.
How to trade volume imbalance
An imbalance reading exists on every candle, so on its own it says little. It becomes useful when it lines up with a level that matters.
- Use a level. A retest of a session point of control (POC, the price where the session traded the most volume), a prior high or low, or a supply or demand zone gives the imbalance something to confirm.
- Match the read to the context. Momentum readings fit continuation entries; absorption readings fit reversal entries at the edge of a move.
- Prefer volume-rich instruments. Futures and large crypto pairs report continuous traded volume, so the lower-timeframe data has more to sort.
- Plan the exits separately. The reading tells you about participation, not where your stop or target belongs.
Common mistakes
- Treating a big number as a trade. A 60% imbalance in the middle of nowhere is context, not an entry.
- Confusing the three meanings. An ICT body gap, a footprint imbalance and an intrabar imbalance measure different things. Make sure the tool measures the one your method uses.
- Reading a proxy as an order book. Intrabar figures rebuilt from lower-timeframe volume are not live depth of market.
- Checking signals far back in history. TradingView limits how much lower-timeframe history it serves, so intrabar readings cover recent bars only.
- Using it on instruments with thin or unreliable volume. The output is only as good as the volume data behind it.
How Intrabar DOM Imbalance handles it on TradingView
Intrabar DOM Imbalance calculates the intrabar reading described above from a lower-timeframe feed (1 minute by default) and adds session context around it.
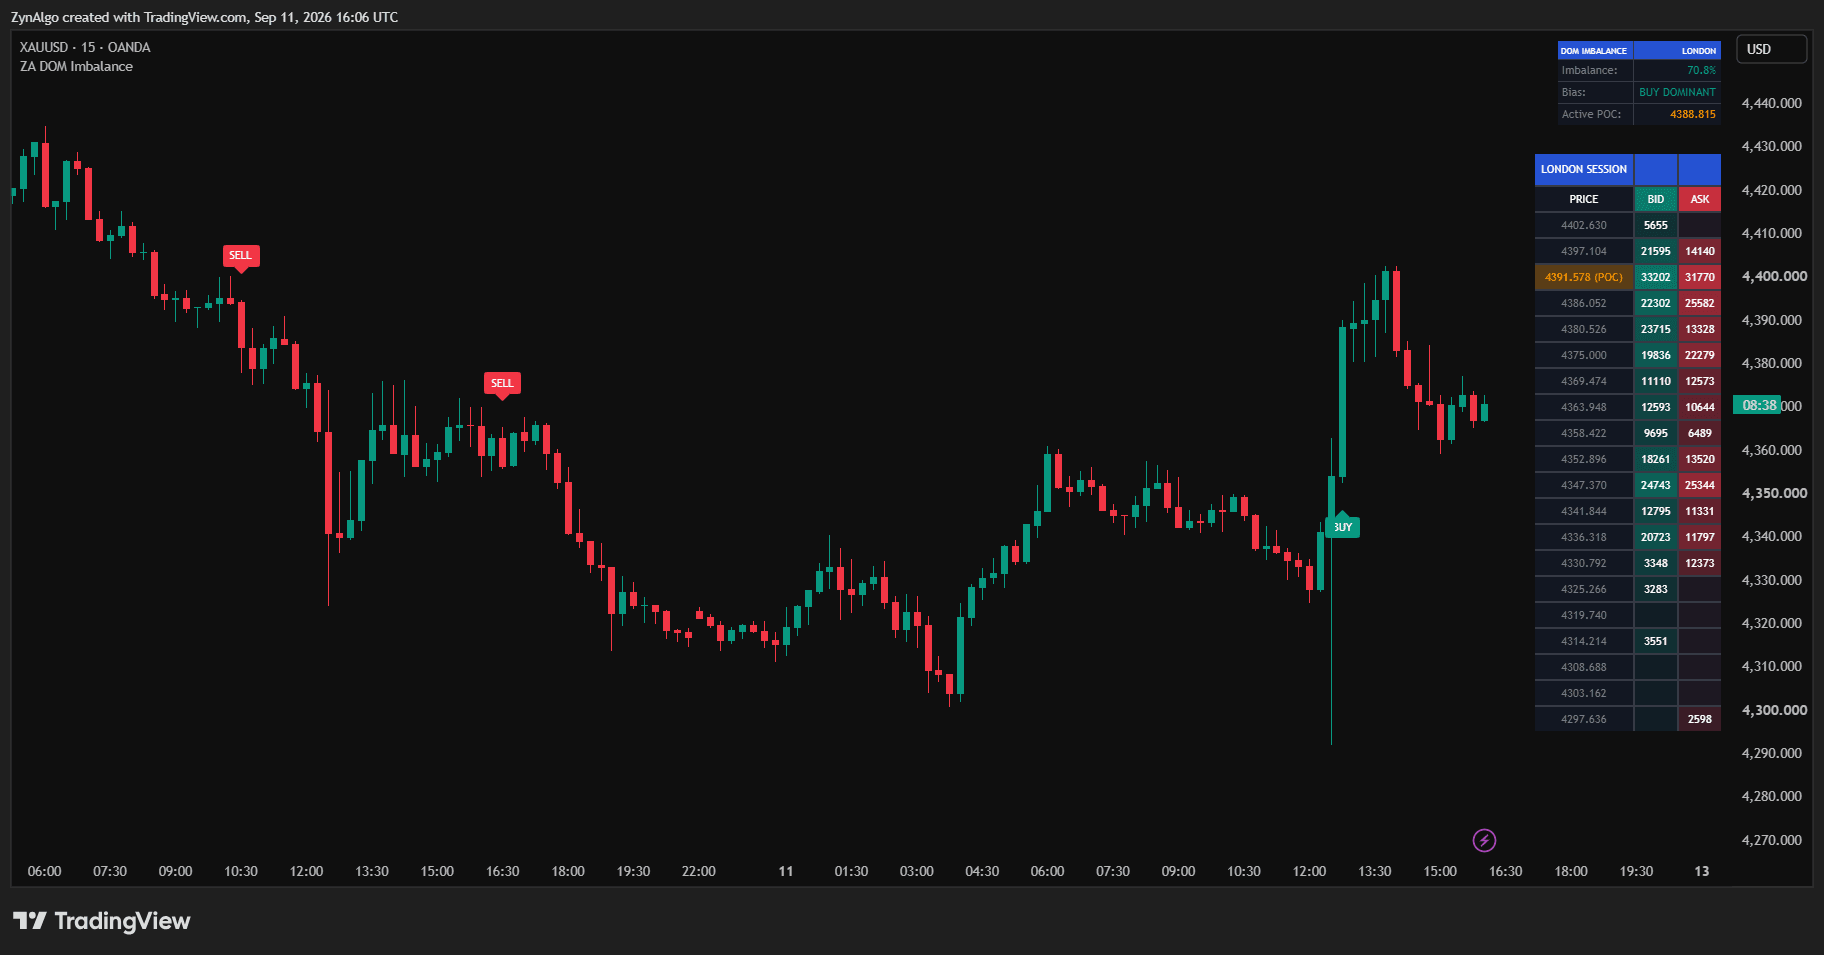
- Dashboard: a "DOM IMBALANCE" panel shows the active session (ASIA, LONDON, US/NY or NONE), the current Imbalance %, a Bias label (BUY DOMINANT, SELL DOMINANT or NEUTRAL) and the Active POC price.
- Session profile: for each enabled session (Asia, London and US/NY, each with its own switch and hours in UTC), intrabar volume is stacked into a set number of price levels (20 by default) across the session's range and split into bid-style and ask-style columns by the direction of each lower-timeframe bar. The level with the most volume is the session POC, rebuilt as the session runs and cleared when the next one starts.
- Signals: a BUY or SELL marker prints only when three things agree on one closed candle: the imbalance clears the Imbalance Threshold (20% by default), the candle shape matches the Signal Type, and the candle's wick touched the active session POC (within a tolerance of 0.3 x ATR(14) by default) and closed back on the right side of it. A cooldown (10 bars by default) keeps markers apart.
- Signal Type: Momentum wants a candle that agrees with the imbalance and has a body of at least 50% of its range by default. Divergence wants a candle whose colour disagrees with the imbalance, the absorption read.
- Explained markers: hovering a label shows the signal type, the imbalance against your threshold, the body ratio, the session, the POC price retested and the close. Two alert conditions fire on the same rules.
The manual is direct about one limit: the bid, ask and DOM table are a proxy rebuilt from lower-timeframe volume, not a live order book.
Worked example: a London POC retest

Say you are watching the London session on a 5-minute EURUSD chart with Signal Type set to Momentum. Price has drifted up since the open and the London POC sits a little below current price. The dashboard shows the imbalance climbing and the bias turns BUY DOMINANT.
A few bars later one candle wicks down into the POC band, holds, and closes back above the POC with a bullish body over half its range, while its intrabar imbalance reads above 20%. That is the bar that gets a BUY marker. Hovering it shows the numbers behind it, so you can judge the setup instead of taking the marker on faith. Your stop and target are still your decision; below the POC band is one place many traders consider for the stop.
Now take the same session when price is far above the POC. The imbalance and bias keep updating, but no marker prints, because there is no level for the reading to confirm. That silence is deliberate.
Tuning how often markers appear
Too few markers: lower the Imbalance Threshold or widen the POC Touch Tolerance. Too many: tighten those or lengthen the cooldown. Where session hours overlap, Asia takes priority over London and London over US/NY; switch off the higher-priority session if you want to work the later one.
For a per-price-level view of each bar's volume, Footprint Master Pane breaks bar volume into price levels and shows which side leaned on each one. For cumulative delta and absorption tags on surge volume, see Tick Delta Pro.
Frequently asked questions
What is a volume imbalance in trading?
It depends on context. In ICT price action it is a gap between two consecutive candle bodies whose wicks overlap. In order flow it is a price level where aggressive buying or selling outweighs the other side by a set ratio. In intrabar analysis it is the difference between volume traded in the upper and lower half of a candle.
Is there a volume imbalance indicator for TradingView?
Yes. Some TradingView indicators use lower-timeframe data to measure where volume traded inside each candle. Intrabar DOM Imbalance does this and combines the reading with session POC levels and candle shape before it prints a marker.
Can TradingView show real bid and ask volume?
Most TradingView indicators cannot read a live order book. Intrabar tools estimate buying and selling from lower-timeframe bars, which is a proxy. Treat it as an estimate of where activity happened, not as depth of market.
Which timeframe works best for intrabar volume imbalance?
Intraday charts such as 5 to 15 minutes, with a 1-minute intrabar feed, give each candle enough lower-timeframe bars to sort while staying inside the history TradingView serves.
Trading involves risk; indicators support decisions, they do not guarantee results.
Intrabar DOM Imbalance TDV
Reads intrabar volume distribution and prints session-anchored BUY/SELL signals on TradingView when imbalance, candle shape and POC retest agree.