NR7 Breakout: How to Trade the NR7 and NR4 Narrow Range Pattern
Quick answer: an NR7 bar is a bar whose high-to-low range is the smallest of the last seven bars. An NR7 breakout is the move that follows when price closes beyond that bar's high or low, on the idea that a period of contraction is often followed by expansion. An NR7 indicator finds these bars for you, frames the range, and marks the break, ideally with a trend filter so you are not trading every tight bar.
The NR7 pattern was popularised by Toby Crabel in his work on short-term price patterns and opening range breakouts, and it is still one of the simplest volatility-contraction setups to define. This guide explains what NR7 and NR4 are, how to trade an NR7 breakout, the mistakes that cause most false starts, a worked example, and how an NR7 indicator on TradingView handles the pattern.
What NR7 and NR4 mean
- NR7 (narrow range 7): the current bar's range (high minus low) is the smallest of the last 7 bars, including itself.
- NR4 (narrow range 4): the same test over the last 4 bars. NR4 bars appear more often; NR7 bars are rarer and mark tighter compression.
- Inside bar combinations: some traders look for an NR4 or NR7 bar that is also an inside bar (its high and low sit within the previous bar's range), which marks an even tighter coil.
The idea behind all of them is the same. Markets alternate between contraction and expansion. When ranges shrink to the narrowest in a week, participants have gone quiet and orders tend to build on both sides of a small box. When price leaves that box, the move can travel. Nothing guarantees it will, and that is why the rules around the break matter more than the pattern itself.
NR7 is traditionally a daily-chart pattern, but the same test works on any timeframe. On very low timeframes narrow bars appear constantly and mean much less.
How to trade an NR7 breakout
1. Mark the range
Once an NR7 bar closes, its high becomes the ceiling and its low becomes the floor. Its midpoint, (high + low) / 2, is a useful reference for later.
2. Decide your trigger
There are two common choices. A stop order placed just beyond the high and low catches the earliest move but also every false poke. Waiting for a close beyond the range is slower but filters out many breaks that reverse inside the same bar.
3. Filter by trend
Breaks in the direction of the larger trend tend to be cleaner than breaks against it. A long moving average, such as a 200-period EMA, is a simple way to decide which side you will take: longs only above it, shorts only below it.
4. Consider a retest
In choppy markets many breakouts fail straight away. Waiting for price to come back and tag the broken edge, then continue, removes some of those false starts at the cost of a later entry and occasionally a missed move.
5. Plan the stop and target before you enter
Common stop choices are the opposite side of the NR7 range, the range midpoint, or a volatility-based distance such as a multiple of ATR. Targets can be fixed reward-to-risk multiples or the next clear level. Size the position from the stop distance. Our guide to setting entry, stop loss and take profit on TradingView covers this step in detail.
NR Engine TDV
Detect narrow-range coils on your chart and mark confirmed breakouts with directional signals for TradingView.

Common NR7 mistakes
- Treating every narrow bar as a trade. The NR7 bar is a setup, not an entry. Without a break, a trend filter and a plan, it is just a quiet day.
- Trading both directions in a strong trend. Taking the counter-trend break of an NR7 inside a strong trend is where many breakout traders give back their gains.
- Entering late. Noticing the coil only after it has already broken leads to chasing. Marking the range when it forms solves this.
- Stops inside the range noise. A stop just a few ticks inside the box is easily taken out by the retest that often follows a genuine break.
- Using it on very low timeframes without a filter. On one-minute charts narrow bars are everywhere, and the pattern loses its meaning.
- Expecting a size for the move. NR7 tells you compression happened. It says nothing reliable about how far the expansion will go.
Worked example: an NR4 coil on a daily chart
Say you are watching the daily chart of a major stock index. For four sessions the range keeps tightening, each bar's high-to-low spread smaller than the one before. On the fifth session the bar qualifies as NR4: its range is the smallest of the last four. You mark its high as the ceiling, its low as the floor, and the midpoint between them.
Two sessions later price closes above the ceiling. Before acting, you check the trend filter: price is above the 200-period EMA, so a long agrees with the larger direction. Because the market has been choppy, you wait for a retest. The next day price dips back to tag the old ceiling, then closes higher again. That is your confirmed break.
From there, the midpoint of the range becomes your invalidation reference: if price falls back through it, the premise of the breakout has failed, whatever your exact stop is. Your stop, target and size follow your plan, whether you place them by hand or use levels an indicator measures for you. The pattern told you a coil formed and broke in the direction of the trend; it did not tell you how far the move would run.
How NR Engine handles NR7 breakouts on TradingView
NR Engine automates the two hard parts of this setup on TradingView: spotting the coil when it forms, and staying patient until the break commits.
The coil box
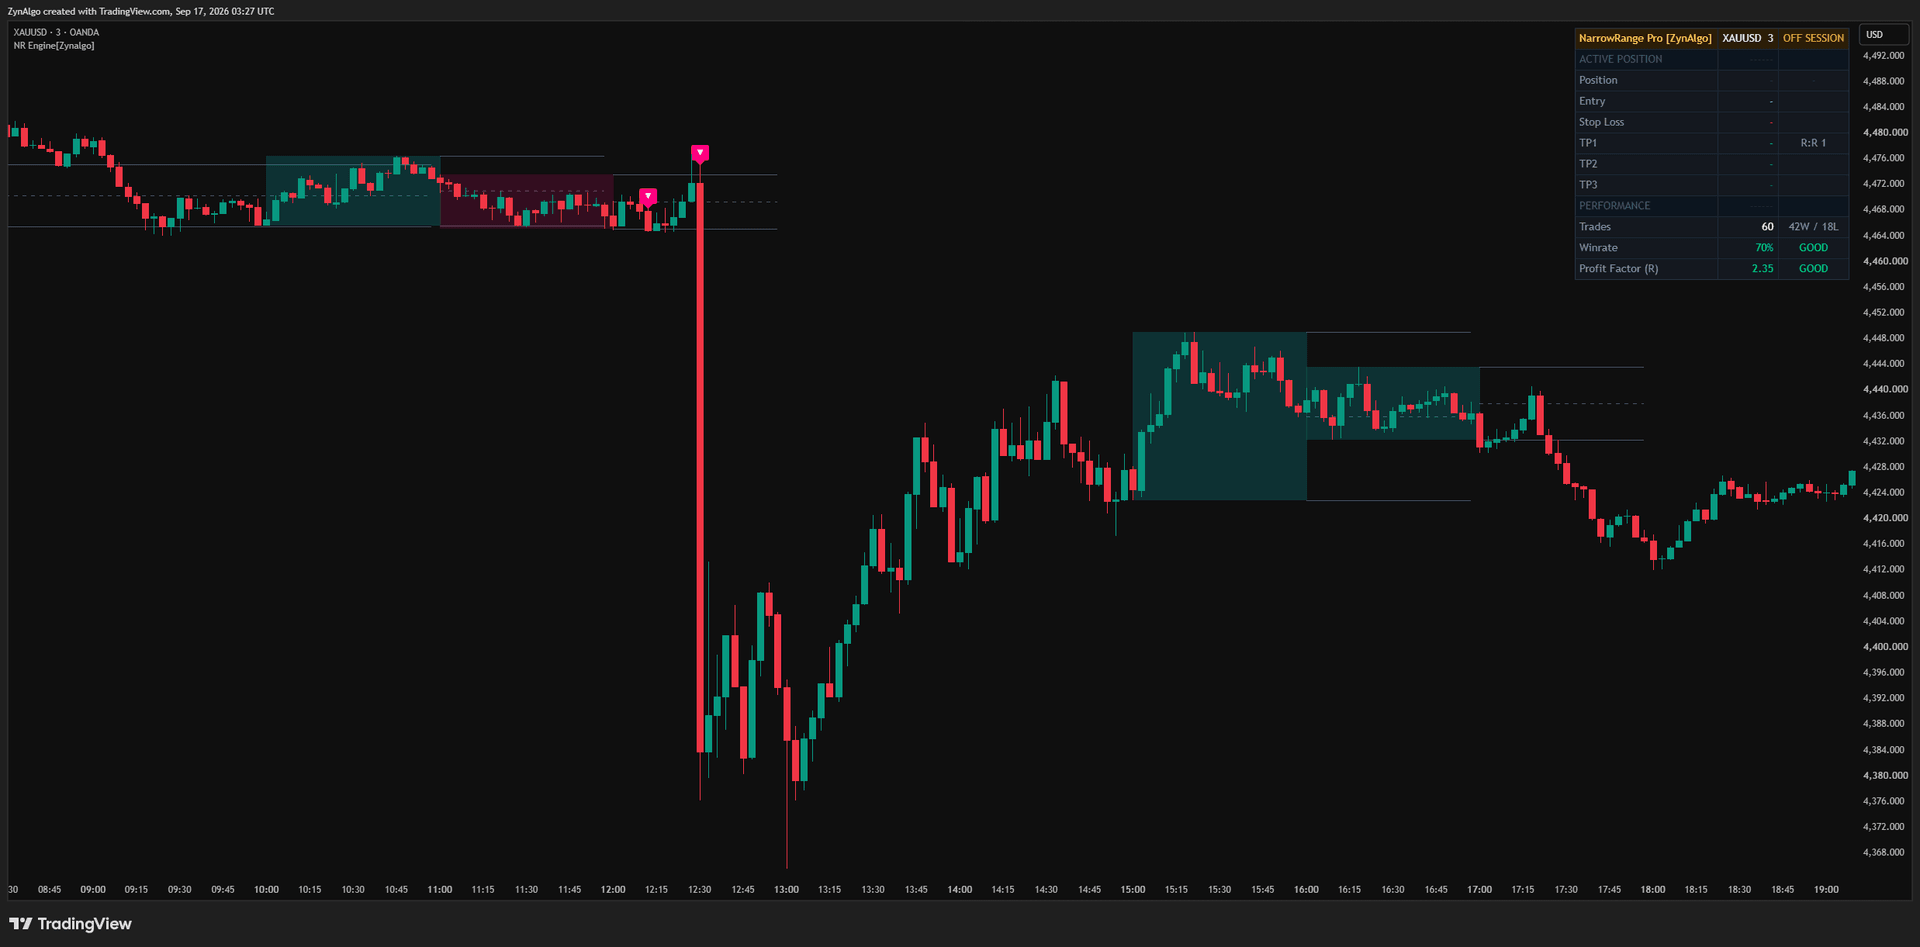
On your chosen Analysis Timeframe (daily by default), NR Engine compares each bar's range with the last 4 bars (NR4) and the last 7 bars (NR7). You choose NR4/NR7 Dual, NR4 Only or NR7 Only; when both qualify, NR7 takes priority as the tighter coil. The qualifying range is drawn as a shaded box, cyan for NR4 and pink for NR7, with a solid ceiling at the range high, a solid floor at the range low and a dashed median at the midpoint. The box extends to the right until a break resolves it.
The break rules
A signal only prints when the whole sequence completes:
- Coil in place: the range qualifies as NR4 or NR7 on the analysis timeframe.
- Boundary break: price closes above the ceiling for a long or below the floor for a short. A reset gate requires price to have pulled back through the median first, so a bar that was already outside the range does not count.
- Trend agreement: with the Macro Trend Filter on (default), up-breaks need price above an EMA of the chosen length (200 by default) and down-breaks need price below it.
- Retest holds: with Retest Verification on (default), price must return to tag the broken edge within the Retest Validation Bars (2 by default) and continue in the break direction.
When every rule passes, a single cyan up-arrow (below the bar) or pink down-arrow (above the bar) marks the confirmed break, once per event.
Entry, stop and targets for every signal
Each confirmed break comes with measured trade levels. Entry is the close of the signal bar, the stop loss sits a multiple of ATR(14) away (2.8 by default, set with the Distance input), and take-profit targets are set as reward-to-risk multiples of that distance: TP1 at 1R is on by default, with TP2 and TP3 available. When TP2 or TP3 is enabled, the stop moves to entry once TP1 is reached. An on-chart panel shows the active setup's entry, stop loss and targets, and the BUY and SELL alerts carry the same levels, ready for webhook automation. Position size stays with you.
Earlier or cleaner: your choice
If you prefer fewer, cleaner breaks, keep the retest filter on. If you want the earliest possible entry, switch it off and take the raw boundary break, accepting more noise. The median line remains your invalidation reference either way.
Who it suits
- Breakout traders who want the coil found for them rather than scanning every tight bar.
- Swing traders working daily setups, where a handful of NR4 and NR7 coils is the point, not a flood of signals.
- Momentum traders who want a trend filter and a retest check between them and sideways chop.
- Traders who want a repeatable box, ceiling, floor and median plus a measured entry, stop and targets with every signal.
NR Engine does not tell you how far a break will run, and a confirmed break can still fail and reverse. If a market never compresses into a clean NR4 or NR7, there is nothing for it to frame. If you also trade breaks of swing trendlines, Swing Trendline Break & Fakeout separates confirmed breaks from failed ones with its own confirmation window.
Frequently asked questions
What is an NR7 day?
An NR7 day is a trading day whose high-to-low range is the narrowest of the last seven days. It signals that volatility has contracted, which traders watch as a possible lead-in to a range expansion.
What is the difference between NR4 and NR7?
NR4 compares the bar's range with the last four bars, NR7 with the last seven. NR4 appears more often; NR7 is rarer and marks a tighter coil. Many traders watch both.
How do you trade an NR7 breakout?
Mark the NR7 bar's high and low, wait for price to break one side (with a stop order or on a close), favour breaks in the direction of the larger trend, and set your stop at the opposite side, the midpoint or a volatility-based distance before entering.
Does the NR7 pattern work on intraday charts?
The test works on any timeframe, but narrow bars are far more common on low timeframes and carry less meaning there. Many traders scan for NR7 on the daily chart and use an intraday chart only to time the entry.
Is there an NR7 indicator for TradingView?
Yes. NR Engine scans for NR4 and NR7 bars on a chosen analysis timeframe, draws the range as a box with ceiling, floor and median, and marks confirmed breaks after optional trend and retest filters, with an entry, ATR-based stop and take-profit targets for each signal.
Trading involves risk; indicators support decisions, they do not guarantee results.
NR Engine TDV
Detect narrow-range coils on your chart and mark confirmed breakouts with directional signals for TradingView.