NinjaTrader Renko: How to Set Up, Read and Trade Renko on NinjaTrader 8

Quick answer: NinjaTrader 8 lets you build Renko charts by setting the chart's data series type to Renko and choosing a brick size in ticks; a new brick prints only when price travels that distance, so time disappears from the chart. The trade-off is that you lose session timing and a consistent view of volume. A Renko indicator for NinjaTrader 8, such as an overlay that calculates bricks internally and draws them over normal candles, gives you the brick trend read while keeping your time-based chart.
NinjaTrader Renko charts are popular for a simple reason: it removes most of the small back-and-forth that makes a trend hard to read. But it also changes how almost everything else on the chart behaves. This guide covers how Renko works on NinjaTrader 8, how to choose a brick size, how to trade it, the mistakes that catch most people, and when a Renko overlay on a time-based chart is the better choice.
What a Renko chart is
A Renko chart is built from bricks of a fixed price size. A new brick in the current direction prints when price moves one brick size beyond the last brick. A brick in the opposite direction needs a larger move, usually two brick sizes, which is what keeps a Renko chart from flipping on every small pullback. Time plays no part: a quiet hour may print no bricks at all, a fast minute may print five.
The result is a chart that shows direction very clearly. A run of same-colour bricks is a trend; alternating colours is a range. That clarity is the whole appeal, and also the source of most of its problems.
How to set up Renko on NinjaTrader 8
- Open a new chart, or open Data Series on an existing chart.
- Choose the instrument, then set the bar Type to Renko.
- Enter the Brick size in ticks. A sensible first value is close to the instrument's typical bar range on the timeframe you normally trade; you will adjust it in the next step.
- Load enough days of history to see several trend legs at the brick size you chose.
Because bricks are built from price movement, accurate historical bricks need tick data, or Tick Replay enabled on the data series. Without it, history is rebuilt from bar data and can differ from what you would have seen live. Real-time bricks are built from the live feed.
If you want a Renko series built directly from the tick feed, with a configurable reversal distance and a consistent way of filling session gaps, the Renko Bar Type for NinjaTrader 8 is a separate bar type you can add to the Data Series list.
Renko Trend Heatmap NT8
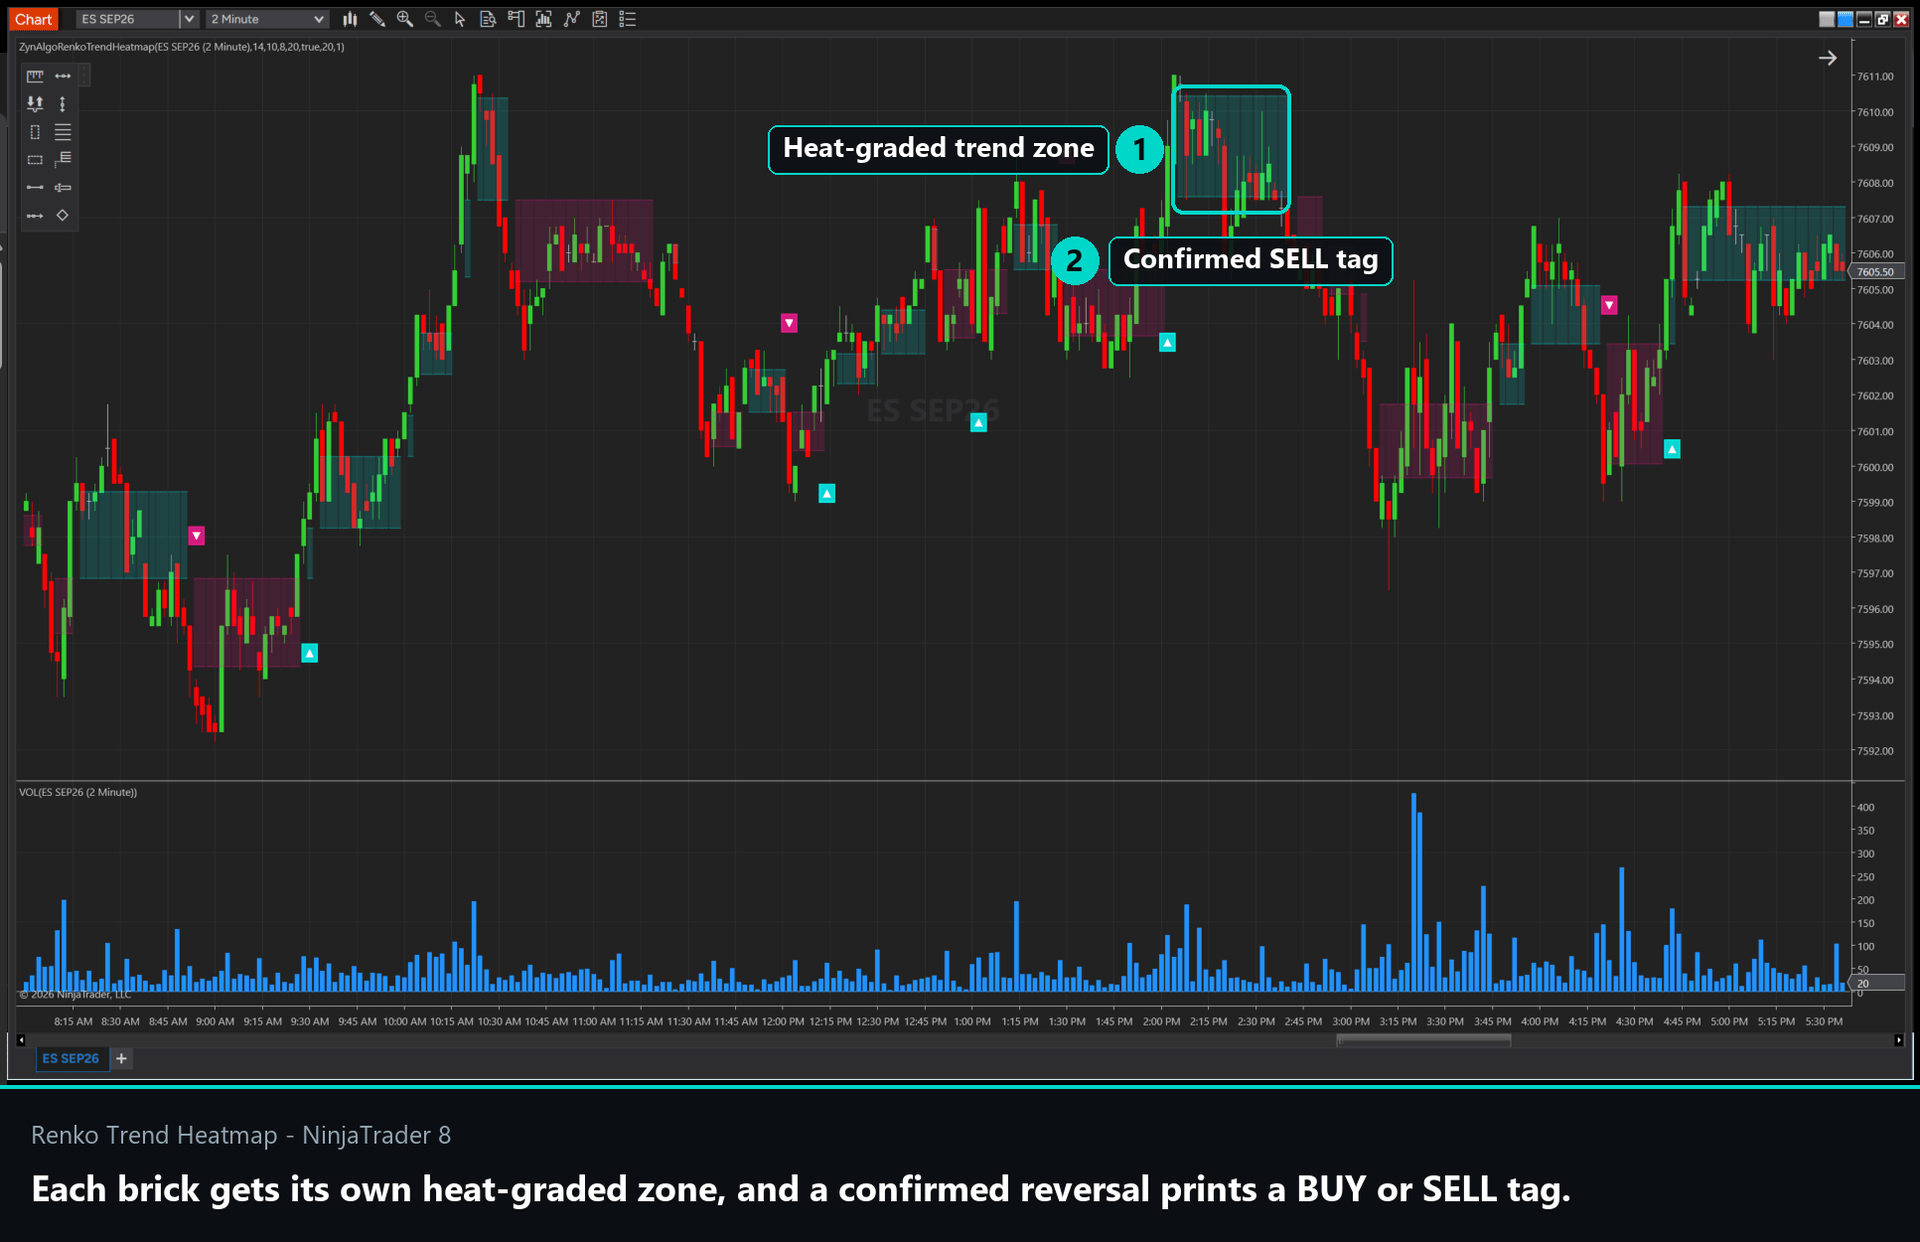
Map stepped brick trends onto your NinjaTrader chart, only confirming direction changes when volume backs them.

Choosing the brick size
Brick size is the single most important Renko decision, and there is no universal answer.
- Too small: the chart starts to look like a noisy line chart. Every minor pullback becomes a reversal brick and the trend read is gone.
- Too large: the chart prints very few bricks, reversals arrive late, and a large part of each move happens before the chart shows it.
- A practical starting point: size the brick near the instrument's recent average bar range (ATR) on the timeframe you would otherwise trade, then adjust until a normal pullback in a trend does not print a reversal.
The catch with a fixed brick is that volatility does not stay fixed. A size that works in a quiet morning is too small after a data release, and a size that suits a fast session is too slow in a midday lull. This is the main reason some traders move to adaptive, volatility-based brick sizes.
How to trade Renko bricks
Trend continuation
The most common Renko approach is to trade in the direction of the current run. After a run of up bricks, wait for a pullback of one or two bricks, then look for the next brick back in the trend direction as the trigger. Stops are usually placed beyond the pullback, measured in bricks.
Reversals
A first reversal brick after a long run is a warning, not a confirmed turn. Many traders wait for a second brick in the new direction, or for some other confirmation, before treating it as a change of trend.
Ranges
Alternating bricks of both colours mean there is no trend to follow. Renko does not make a sideways market tradeable; it simply shows you that it is sideways.
Common NinjaTrader Renko mistakes
- Reading time-based indicators on bricks. A 20-period moving average on Renko is 20 bricks, which can be ten minutes or a whole day. Session-based tools and anything that assumes equal time per bar lose their meaning.
- Treating brick volume like candle volume. Volume per brick depends on how long the brick took to form, so it is not comparable from brick to brick the way volume per five-minute bar is.
- Trusting history without tick data. Historical bricks rebuilt from bar data can look cleaner than what traded live. Use tick data or Tick Replay when you review past setups.
- Using one brick size for every market condition. A fixed size that works in one session can fail in the next.
- Running two charts and syncing them by eye. Many traders keep a Renko chart for structure and a time chart for timing. That works until the market moves fast and you are reading two charts instead of one.
Renko overlay: brick trend on a normal NinjaTrader 8 chart

A Renko overlay indicator calculates the brick structure from the bars on your chart and draws the stepped result over your normal candles. You keep your candles, your session structure and your volume, and gain a band that shows the current brick trend. It is an approximation of a true Renko chart, because it is built from bar closes rather than from every tick, but it removes the need for a second chart.
Renko Trend Heatmap for NinjaTrader 8 is built this way, with three additions that address the problems above.
Adaptive brick size
Each brick's size starts from ATR (Base ATR Period, 14 by default). It is then scaled by the ratio between the current standard deviation of closes (Volatility Lookback, 20 by default) and its own longer-term average. That scaling is capped between half and double the base size. In a quiet range the bricks compress so the structure stays responsive; in a fast session they expand so ordinary swings do not flip the state.
Volume-gated reversal markers
The band turns when the internal structure completes a move in the opposite direction. A reversal marker (an up or down triangle) is only printed when that turn happens on a bar whose volume is at or above its recent average (Volume MA Period, 20 by default) multiplied by the Minimum Volume Multiplier. A structural flip on thin participation is the kind of move that often reverses again a few bars later, and the volume condition keeps those from being reported as reversals. The volume filter can be switched off if you want every turn marked.
Streak shading
The colour depth of the band tracks how many bricks the current run has lasted, up to the Streak Depth setting (10 by default). A deep shade means a run that keeps extending; a pale band means the structure has only just turned. A fresh turn and a mature trend should not be traded the same way, and the shade shows the difference at a glance.
Worked example: reading the overlay in a session

Say you are on a 5-minute NQ chart mid-morning. The band has been a deep colour through the whole early push, which tells you the trend leg is mature, not fresh. Price pulls back and the structure briefly turns, but volume on that bar is below the threshold, so no reversal marker prints. A thin-volume dip inside an established trend is not the same event as a volume-backed reversal, and the indicator does not report it as one.
An hour later the structure turns again, and this time the confirming bar carries volume above the threshold. A marker prints and the band goes pale, signalling a young trend rather than an extension of the old one. You still decide whether to act, where your stop goes and how much to risk. If you see more markers than you want during a choppy stretch, raise the volume multiplier first, not the brick sizing.
Renko chart or Renko overlay: which to use
| Renko chart (bar type) | Renko overlay on a time chart | |
|---|---|---|
| Brick construction | From the price feed, true Renko | Approximation from bar data |
| Session timing | Lost | Kept |
| Volume per bar | Varies with brick duration | Normal time-based volume |
| Other indicators | Time-based tools change meaning | Work as usual |
| Best for | Pure brick traders | Traders who want brick trend plus time context |
Many traders use both: a Renko chart when they want the purest brick read, and an overlay on their main execution chart. To add a separate read on buying and selling pressure behind a turn, Tick Delta Pro for NinjaTrader 8 estimates delta per candle and tags divergence and absorption.
What the overlay does not do
In a genuinely sideways market the state can flip repeatedly no matter how the sizing adapts, because there is no clean trend for bricks to describe. Renko Trend Heatmap does not place trades or set stops and targets. On instruments where the data feed reports little meaningful volume, the volume gate has less to work with.
Frequently asked questions
Does NinjaTrader 8 have Renko charts?
Yes. Renko is one of the bar types in the Data Series settings. You choose Renko as the type and enter a brick size in ticks. Additional Renko bar types can also be installed.
What is the best Renko brick size for NinjaTrader 8?
There is no single best size. Start near the instrument's average bar range on the timeframe you would otherwise trade, then adjust until normal pullbacks in a trend do not print reversal bricks. Because volatility changes during the day, some traders prefer an ATR-based, adaptive brick.
Why do my historical Renko bricks look different from live?
Historical bricks are only as detailed as the data behind them. Without tick data or Tick Replay, NinjaTrader 8 rebuilds history from bar data, which can hide moves that happened inside a bar. Live bricks are built from the real-time feed.
Can I use Renko and normal candles on the same chart?
Not as two bar types in one panel, but a Renko overlay indicator calculates the brick trend from your time-based bars and draws it over the candles, so you see both on one chart.
Is volume useful on Renko charts?
Volume per brick is hard to compare because each brick takes a different amount of time. Volume is easier to use on a time-based chart, which is why a Renko overlay can apply a volume condition to trend changes.
Trading involves risk; indicators support decisions, they do not guarantee results.
Renko Trend Heatmap NT8
Map stepped brick trends onto your NinjaTrader chart, only confirming direction changes when volume backs them.