Trend Following Indicator for TradingView: Confirmation Over Noise
Trend Following Indicator for TradingView: Confirmation Over Noise
You've bought at an oversold RSI reading only to watch price fall further. You've used tools that print arrows constantly and couldn't decide which ones mattered. You've followed trends only to find yourself holding through reversals that erase weeks of gains.
The best trend following indicator for TradingView doesn't follow every trend - it waits for confirmation first. Trendline v5.0 distinguishes genuine reversals from noise by watching whether price is actually ranging (a flat Sentiment Range MA) before firing RSI-based entries at the edge of the 50-bar range.
What separates a usable trend following indicator for TradingView from a lagging one
Most tools either chase price in all conditions or lag so far behind they miss the move entirely. Trendline v5.0 splits the difference with three layers of precision:
Confirmation on closed candles. A stepped, range-based moving average called the Sentiment Range MA only re-centres when price breaks outside an ATR-sized band. It holds its state across multiple bars, filtering out noise and false moves. Crucially, in Mode 4 (the default), it refuses to generate signals while this average is rising or falling - only when it is flat, which marks genuine ranges. This removes the classic trap of buying oversold RSI inside an active downtrend.
Filters reduce impulsive entries. Stability Mode keeps new signals from printing while a trade is still open. A 10-bar cooldown enforces space between signals. An optional Smart Signal Filter prevents back-to-back entries in the same direction. Each filter removes a class of false entries without blocking the real setups.
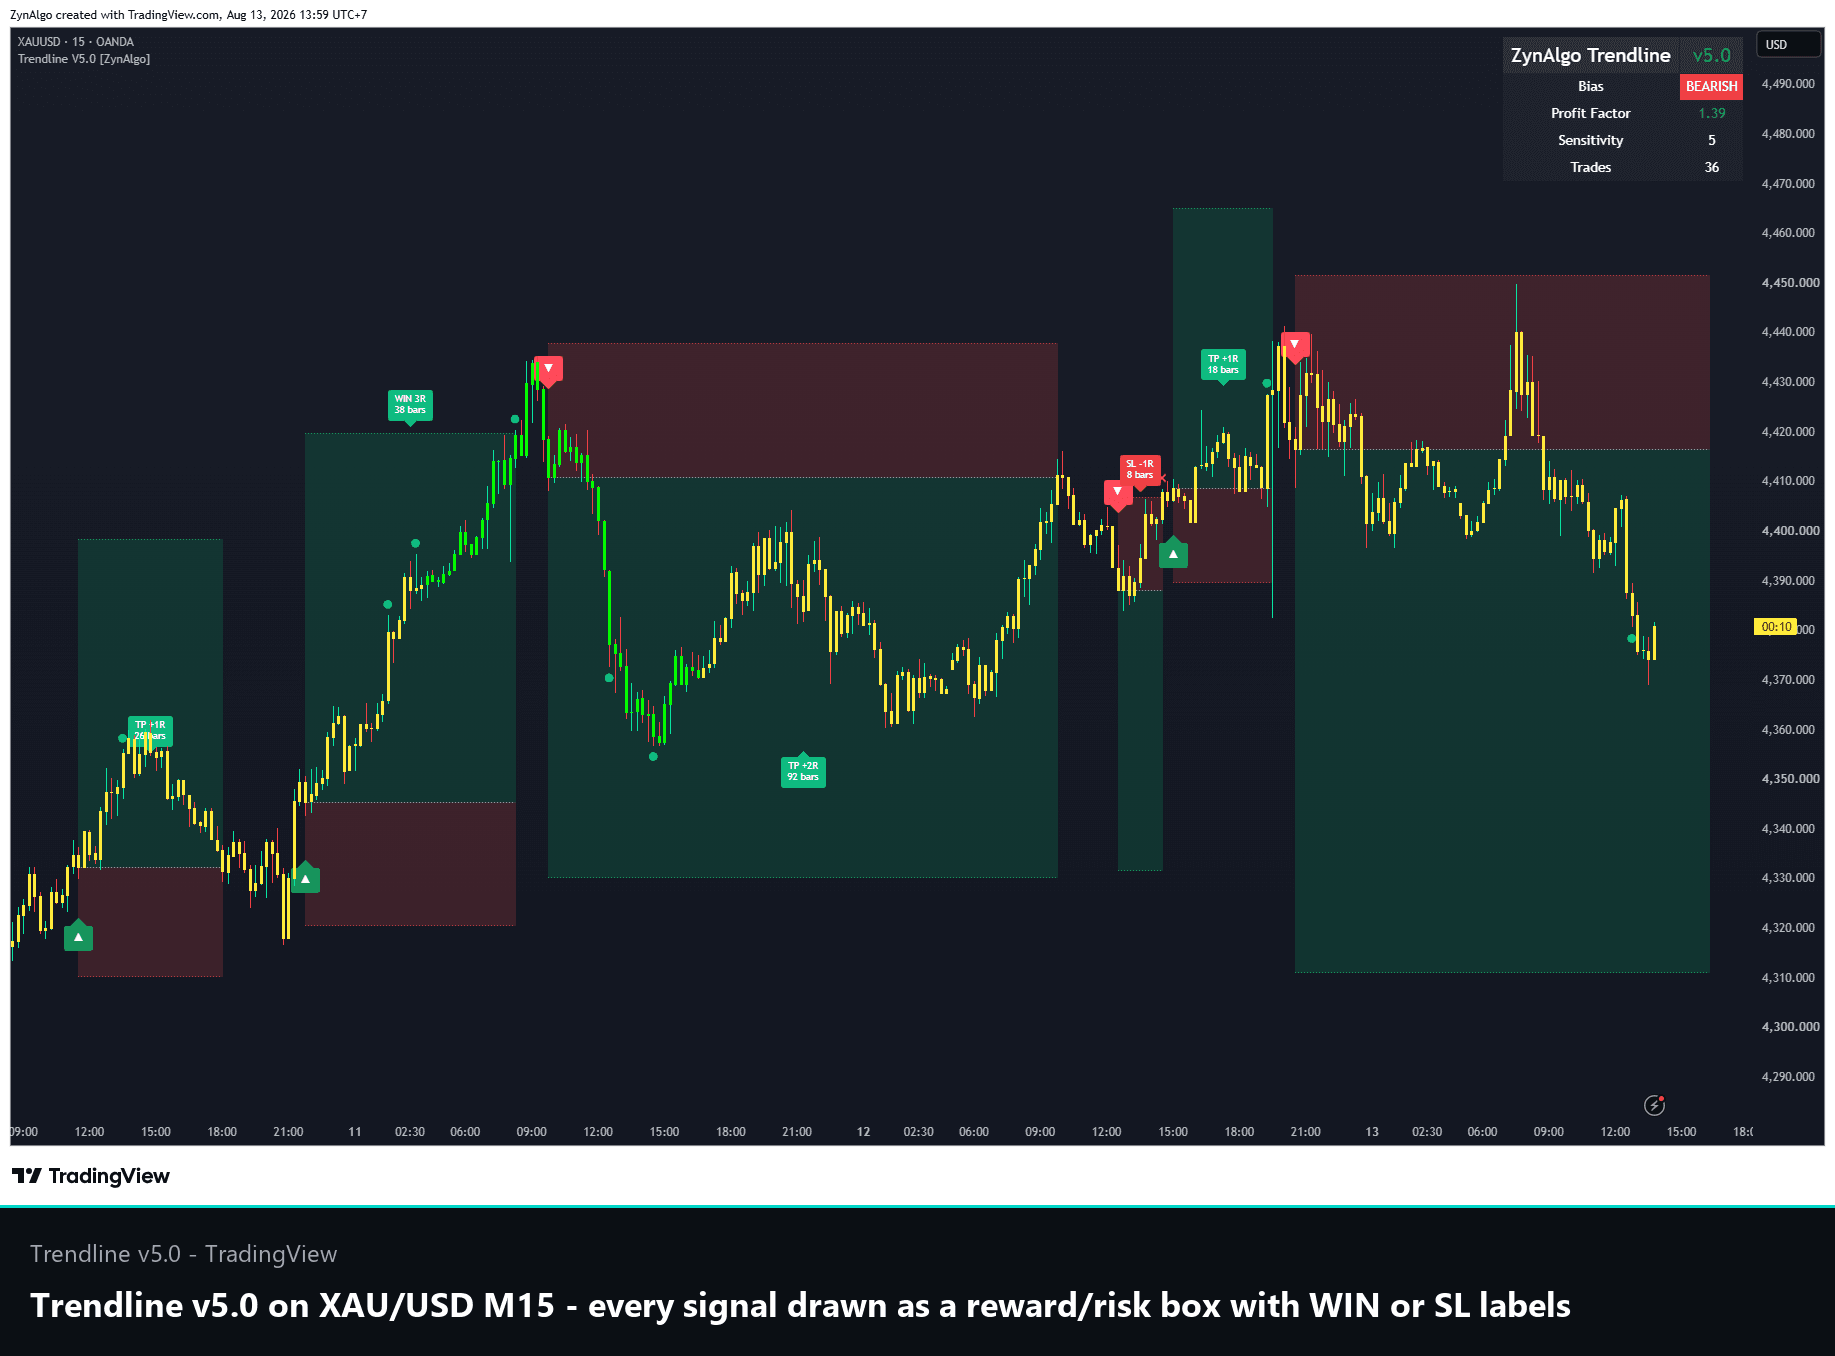
Exits are pre-drawn before entry. On the bar a signal fires, Trendline v5.0 draws the full trade plan: a red risk box down to an ATR(14) x 2.8 stop, a green reward box up to targets (TP1 at 1R by default, TP2 at 4.5R, TP3 at 6.5R optional). You see entry, stop and target in one frame. No mid-trade guessing. When the trade closes, a label stamps it WIN 3R (or SL if stopped) plus the bar count.
How it fires in a real session
Watch a one-hour EUR/USD chart after a period of choppy consolidation. Price bounces off the lower edge of the range. On the close of that bounce bar, four things align:
- RSI has turned back up from below 32 (oversold territory)
- That turn was a higher close than two bars ago (momentum reversing)
- Price is sitting in the bottom 30% of the last 50 bars' high-low range
- The Sentiment Range MA is flat, shown as sideways candles
At that moment, a green triangle prints below the bar marking entry. The red risk box drops to the stop. The green reward box projects to the target. Small green dots will mark each interim milestone (1R, 2R) if price reaches them. When price hits the target or stop, a result label closes the box.
You can read back and see exactly why the signal fired: RSI reversed, price was stretched, the Sentiment Range MA was flat. That context is baked into the chart itself.
Trendline v5.0 TDV
Identify range reversals when RSI turns at the edge of the 50-bar range, then draw your complete trade plan with entry, stop loss, and targets as reward and risk boxes.

What it does not do
Trendline v5.0 in Mode 4 (the default and the mode this manual emphasises) is a range-reversal tool, not a pure trend-follower. If your strategy is to hold entire trends from bottom to top, this engine will feel too quiet. It enters on reversals inside ranges, not on trend continuations.
If you prefer to follow trends, the tool offers Mode 1 (EMA stack pullbacks) and Mode 2 (first EMA stack in order) to trade with momentum instead of against it.
No indicator eliminates false signals. RSI can reverse at the edge of a range and price can still fail to extend. The tool reduces false entries through filters and shows your risk and reward upfront so you learn which setups worked and which didn't.
Trendline v5.0 does not predict price direction. It observes where RSI has reversed and where price sits in a known range. That is observation, not forecast.
Trading carries real risk. Signals are analytical tools, not financial advice. Past performance does not predict future results. No indicator can tell you how price will move.
Who this is built for
You fit this tool if you:
- Trade liquid ranges on M15 to H4 timeframes: EUR/USD, GBP/USD, gold and index CFDs are ideal candidates
- Prefer defined stops and targets over discretionary mid-trade decisions
- Recognise that oversold inside a downtrend is a trap, not a buying signal
- Want the entire trade plan (entry, stop, target) visible on the chart at entry
- Would rather wait for a few strong setups than act on every RSI extreme
You do not fit this tool if you:
- Trade pure breakouts or want to be in every trend start to finish (switch to Mode 1 or 2, or use a breakout-specific tool)
- Scalp on minute charts and need a signal on every bar (Stability Mode and cooldown keep entries selective)
- Trade correlated pairs in strong one-directional days (the ranging bias will limit entries)
One clear next step
Load Trendline v5.0 on one-hour EUR/USD with default settings. Let it run for a few days. Set an alert so you catch the next flat Sentiment Range MA signal. Watch three trades close. Write down which hit target, which hit stop. Within that sample you will know whether this tool fits how you think about ranges and reversals. If it does, Footprint Pro can help you see exactly where volume is clustering inside those ranges, confirming your strongest entry candidates before a signal prints.
Trendline v5.0 TDV
Identify range reversals when RSI turns at the edge of the 50-bar range, then draw your complete trade plan with entry, stop loss, and targets as reward and risk boxes.