What is a Trading Indicator: How Trendline v5.0 Turns Price Behavior Into Entry Rules
What is a Trading Indicator: How Trendline v5.0 Turns Price Behavior Into Entry Rules
A trading indicator is a mathematical tool that measures aspects of price action, such as momentum, direction, or range, and converts those measurements into visual signals or rules to support your trading decisions. Trendline v5.0 applies this principle by watching four things at once: how far price is moving inside its recent range, the RSI momentum reading, where price sits within that range, and the volatility environment, then drawing a trade plan on every reversal setup it identifies in choppy, sideways markets.
Most traders have felt the sting of oversold. You see RSI hit 20, the chart looks exhausted, and you take a reversal entry. Then price keeps falling. The catch: oversold means momentum is extreme, not that a turn is coming. In a strong downtrend, oversold simply means the trend is working. A better rule is this, only trade reversals when price is actually ranging, not trending. That distinction is the foundation of Trendline v5.0.
What an indicator actually measures
Trendline v5.0 does not predict the future or know what is coming next. It measures three properties of price that already exist on your chart: the smoothed direction of the market, the location of price inside its recent range, and the momentum reading from RSI at the edges of that range. From those measurements it builds a filter: "Is the market genuinely flat right now?" A stepped average that only re-centres when price breaks outside an ATR-sized band gives you that answer. If the market is flat and RSI has just turned from an extreme, Trendline v5.0 draws a reversal setup.
The Sentiment Range MA is the component that enforces this discipline. Rather than tracking every tick like a standard moving average, this average holds its value while price stays inside a band and only steps to a new level when price pushes outside that band. Because it moves in steps, its slope is a clean read: rising means uptrend, falling means downtrend, flat means sideways. Your candle colour reflects this state instantly. When you see yellow candles, the average is flat, and the tool is allowed to look for entries. When you see green or red candles, the average is rising or falling, and the tool stays silent.
What it cannot know
Your indicator does not know when a trend will end, whether a reversal will hold, or what happens after entry. It measures conditions on your chart right now; it cannot see the future. Trendline v5.0 waits for RSI to reverse at the edge of the 50-bar range while the Sentiment Range MA is flat. If those two things align on the same bar, it draws a signal. But that signal is a setup with defined risk and reward, not a prediction. Price may hit the target, hit the stop, or bounce partway and close in partial profit. The indicator draws all three outcomes as boxes on your chart, but it cannot guarantee which one will happen.
This is why the tool includes multiple engines. The default mode (Mode 4) waits for ranges and reversals. If you prefer to trade with a trend instead, you can switch to Mode 1, 2 or 3, which use stacked EMAs or RSI crossovers to catch momentum moves. Each engine is a different rule set, and your job is to choose which rule set fits your style and the markets you trade.
Trendline v5.0 TDV
Identify range reversals when RSI turns at the edge of the 50-bar range, then draw your complete trade plan with entry, stop loss, and targets as reward and risk boxes.

How a trade plan gets drawn
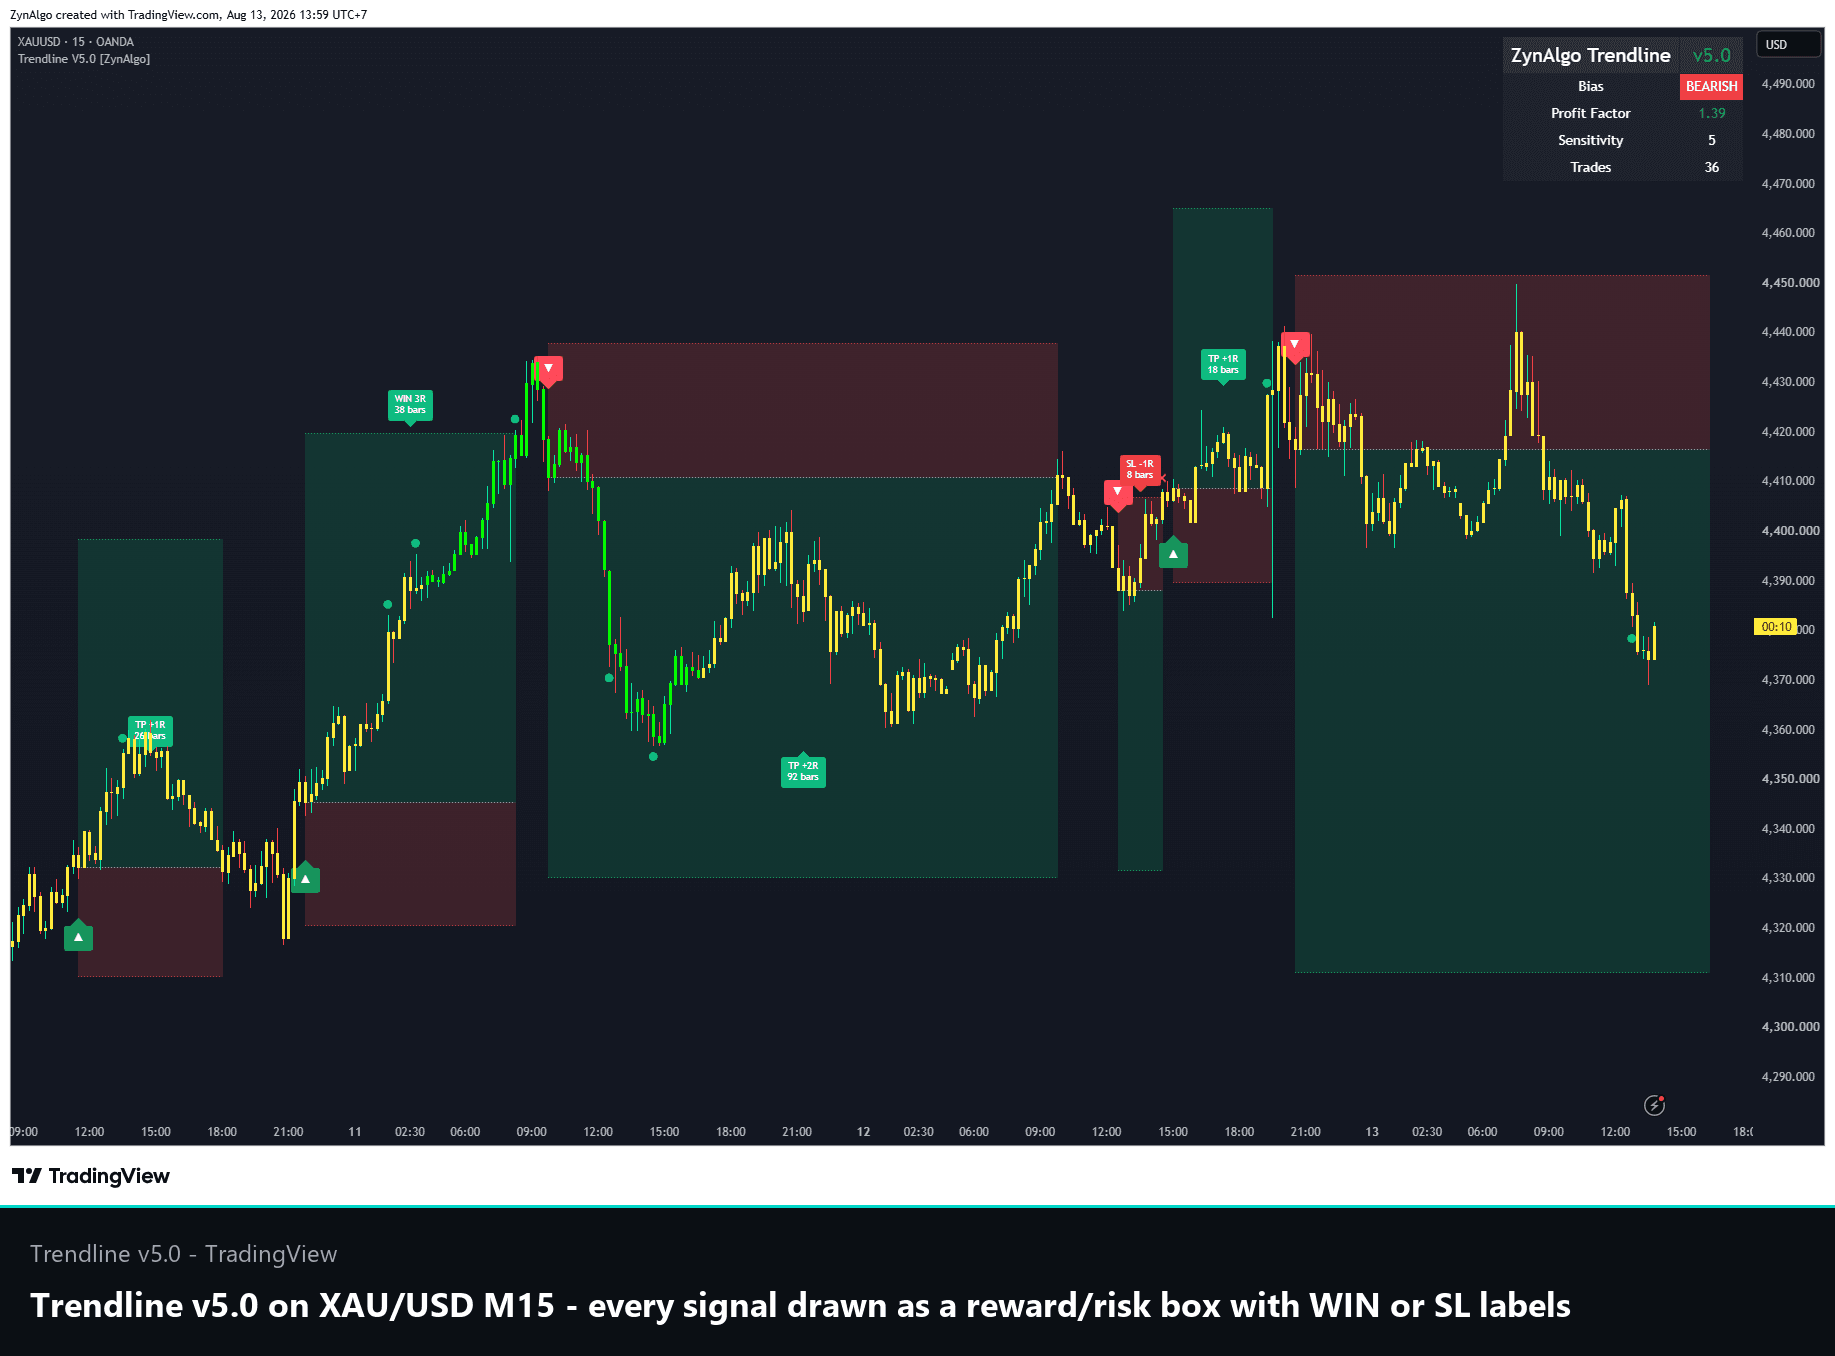
When a reversal signal fires, Trendline v5.0 draws the entire plan at once. A green triangle appears below the bar for a BUY signal, and a green box projects upward from your entry to a profit target. A red box projects downward from your entry to the stop loss, giving you the reward-to-risk ratio at a glance. Entry is the close of the signal bar. The stop sits 2.8 times the 14-bar ATR away from entry, and targets sit at 1R, 4.5R and 6.5R multiples of that risk, though only TP1 is turned on by default.
As price moves, small green dots mark each interim target reached (1R, 2R). When the trade closes, the box gets a label: WIN 3R if the full target was hit, TP +1.5R if price closed in profit after a partial target, or SL -1R if the stop was hit cleanly. The label also shows how many bars the trade took. This visual output removes the need to calculate risk and reward in the moment; the plan is drawn before entry and updated as the trade progresses.
The Sentiment Range MA explained plainly
The Sentiment Range MA works through five steps. First, it measures the high-low range of each candle and smooths that range over five bars to avoid noise. Second, it calculates how far price must travel before the average is allowed to move: this is the band width, set to eight times the 200-bar average range. Third, it anchors the average to step up or down only when the smoothed top or bottom breaks outside the current band. This removes the clutter of the average jiggling on every small move. Fourth, it smooths the result twice to produce a gently curving line. Fifth, it tests the slope of that line against a 0.001% threshold to classify the market as rising, falling or flat.
From there, RSI(14) supplies the entry trigger. A BUY fires when RSI turns back up from below 32 at the bottom 30% of the 50-bar range, while the Sentiment Range MA is flat. A SELL fires when RSI turns back down from above 68 at the top 30% of the range, with the same flat condition. The tool then enforces spacing: at least 10 bars between signals, and it skips any new signal while a trade is still open (Stability Mode, on by default).
What it does not do
Trendline v5.0 is a range and reversal tool. It is not designed to trade every move or to catch breakouts. In Mode 4, it deliberately stays silent during strong trends because that is when oversold and overbought readings are least useful. If you are a trend-follower who wants to be in every rally or selloff, the default mode will feel too quiet. You can switch to Mode 1 or Mode 2 for a trend-friendly approach, but Trendline v5.0 is fundamentally built to say no more often than it says yes.
It also cannot remove losing trades or stop-outs. Every trade has a defined stop, and when price hits that stop the trade closes at a loss. The tool draws the risk box so you know the size of that loss upfront, but it cannot prevent the stop from being hit. Likewise, it cannot force a target to be reached; price may stall or reverse before the target is reached, leaving you with a partial profit or a breakeven exit.
Trading risk and disclaimer
Trading involves risk of loss. Trendline v5.0 is a decision-support tool that measures price behavior and applies rules to identify potential reversal setups. It does not predict future price movement, does not guarantee any outcome, and is not financial advice. Past results do not predict future results. Use a defined risk per trade, never risk more than you can afford to lose, and understand the full mechanics of the tool before using it on real capital. Your broker and market conditions determine what is possible; the indicator generates signals based on its rules, not on market certainty.
Next step
Try Trendline v5.0 on your most liquid chart using the default settings. Spend a few bars watching how the Sentiment Range MA colours the candles yellow when the market is flat and green or red when it is trending. Notice where RSI turns at the edges of the range; that is the exact condition the tool looks for. The trade boxes and result labels appear on close, so you can see the full plan and the outcome on the same chart.
Trendline v5.0 TDV
Identify range reversals when RSI turns at the edge of the 50-bar range, then draw your complete trade plan with entry, stop loss, and targets as reward and risk boxes.