Why Price Whipsaws at the Bollinger Band Midline (and How to Filter It)
You're watching a 15-minute chart. Price closes back over the moving average or Bollinger Band midline, and for a second it looks like the pullback is done and the trend is resuming. Two bars later price crosses back the other way, your entry gets clipped, and the actual continuation happens without you a few candles after that. This is why price whipsaws at the bollinger band midline so often: a single line cross is a frequent event, not a rare one, so treating every cross as a signal on its own catches a lot of false starts along with the real ones.
What the tool does
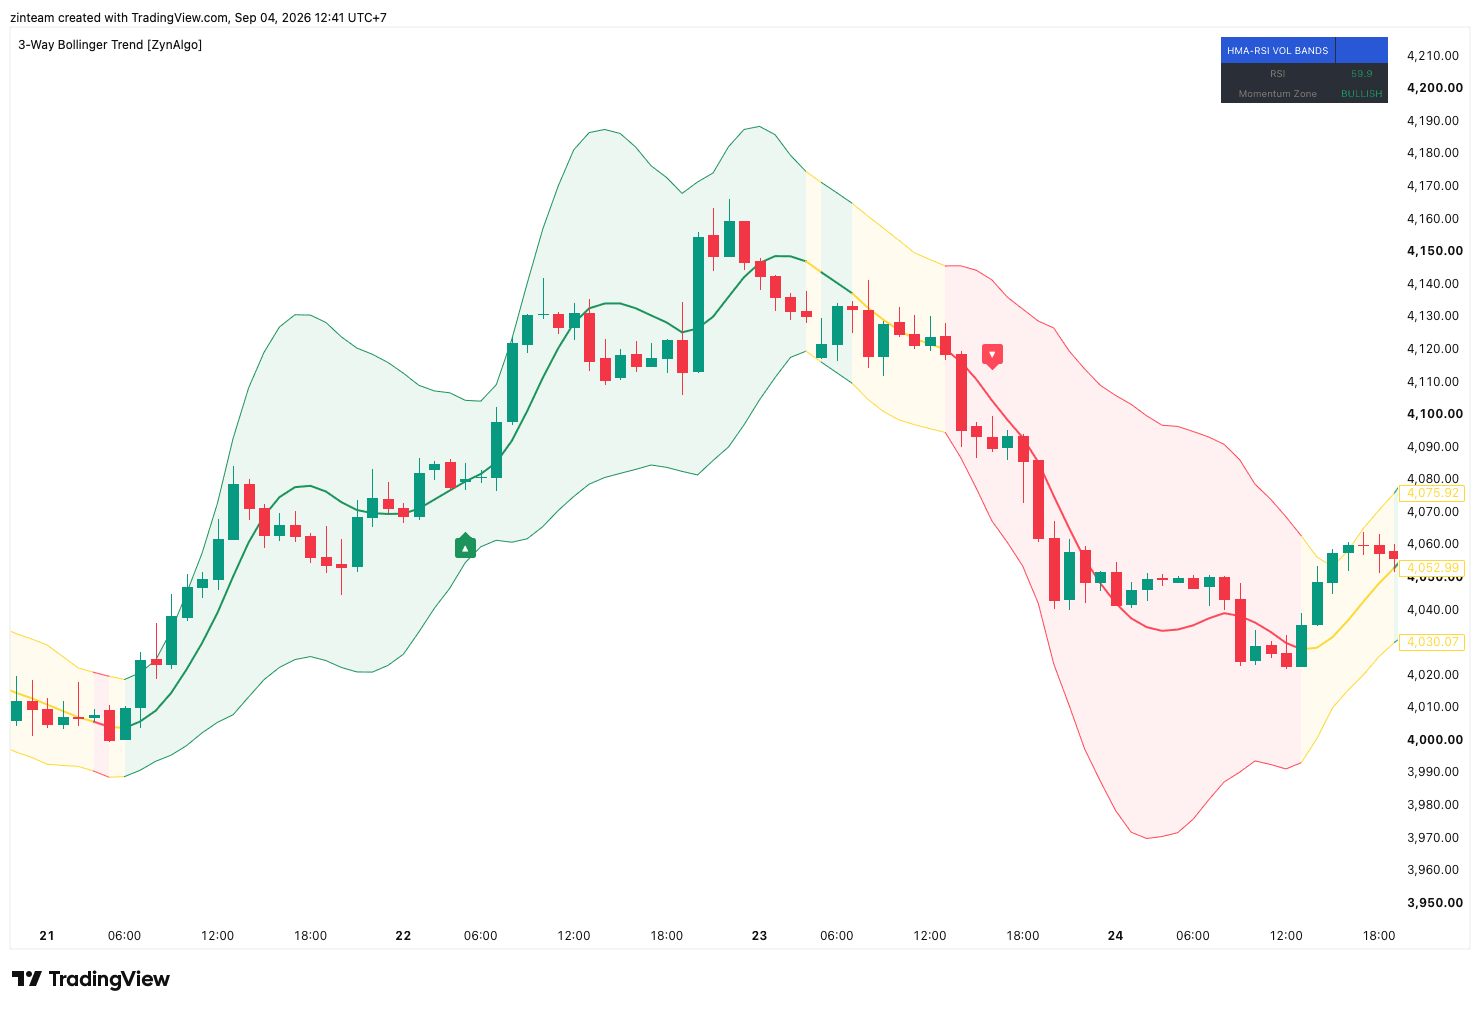
3-Way Bollinger Trend TDV is a TradingView indicator built around that specific problem. It layers three things on one price band: a fast center line, a volatility band built in the spirit of a classic Bollinger Band (it widens and narrows with recent volatility), and momentum-based coloring that marks the band and line as bullish, bearish, or sideways.
The part that matters for the whipsaw problem is how it decides a signal is real. Instead of firing the moment price crosses the center line, it splits the event into two stages. First price has to close back on the trend side of the line (the trigger). Then it has to hold on that side for a number of additional closed bars without crossing back (the confirmation). Only when both stages complete does a signal fire. If price crosses back during confirmation, the setup is cancelled and the indicator waits for a fresh trigger. All of this runs on fully closed bars only, so a signal will not appear and then quietly disappear as an in-progress candle changes shape.
Direction is gated by what the manual calls the effective trend: the indicator remembers the last time momentum clearly read bullish or bearish, and keeps enforcing that direction through sideways (yellow) stretches until a fresh bullish or bearish reading appears. A yellow band does not mean both directions are open. It means the last established trend is still the one being followed.
Using it in a real session
Say you are on a 1-hour chart of an index CFD that has been trending down for two sessions. Price rallies into the center line, the coloring is still bearish, and a naive "crossed the midline, must be reversing" read would have you looking for longs. Because the tool requires price to hold on the bearish side after any cross, and because the effective trend keeps sell as the only allowed direction while momentum is unresolved, a bounce that crosses and immediately fails never becomes a confirmed signal. If price instead holds below the line for the set confirmation window, a sell signal fires on the open of the next bar, with a stop placed off recent volatility rather than off the wick of the signal candle.
3-Way Bollinger Trend TDV
Reads trend, volatility and momentum in one price band, firing pullback signals when price closes back to the center line and confirms, with ATR stops and multi-R take profit levels on TradingView.

Who it fits
This suits a trader who already thinks in terms of trend continuation, wants to enter pullbacks rather than guess reversals, and is comfortable waiting a few extra bars for confirmation instead of reacting to the first cross. It is less useful if your style depends on candle-pattern confirmation (pin bars, engulfing candles), since the indicator deliberately does not use candle shape as a filter at all.
What it does not do
- It does not call tops or bottoms at the band edge. The logic is pullback continuation, not band-edge reversal, so it will not behave like a classic mean-reversion Bollinger strategy.
- It does not read candle shape. Reliability comes entirely from the trigger-plus-confirmation pairing, so a setup that would look clean to a price-action trader can still be rejected, or vice versa.
- The on-chart Trades, Win Rate, and Profit Factor figures (visible when Trade Mode is on) come from an internal simulation built into the script. The manual is explicit that this is not an official backtest and is not a substitute for testing on your own instrument, timeframe, and broker data.
- It will not tell you which instruments or sessions it suits best. That still requires your own review across the market and timeframe you actually trade.
- Sideways readings are commonly misread as "no bias." If you skip section 3.3 of the manual on the effective trend, the allowed direction during a yellow band will look arbitrary.
Trading involves risk, and nothing in this article or in the indicator itself is investment advice. Confirmation logic and volatility-based stops change what you can see and measure on a chart; they do not change what a trade will do once it is open.
Pairing it with other tools
Because 3-Way Bollinger Trend TDV is a trend and entry-timing tool, it pairs naturally with tools that cover a different job rather than the same one. Volume Deviation Bands TDV looks at volatility from a volume angle, which can be useful context alongside a price-based band. Core Supply & Demand TDV maps zones where price has previously reacted, which some traders use to see where a confirmed pullback signal is entering relative to prior structure. Neither is required, and combining tools does not change what either one measures on its own.
3-Way Bollinger Trend TDV is free and listed in the ZynAlgo TradingView marketplace under its own product page, where you can read the full manual before adding it to a chart.
3-Way Bollinger Trend TDV
Reads trend, volatility and momentum in one price band, firing pullback signals when price closes back to the center line and confirms, with ATR stops and multi-R take profit levels on TradingView.