Best Supply and Demand Indicators for TradingView in 2026
Quick answer: The best supply and demand indicator for TradingView is the one whose zone rule you can explain in one sentence and check on your own chart. Well-known options include Supply and Demand Visible Range by LuxAlgo, Supply and Demand Zones by Flux Charts, Supply & Demand: Cumulative Volume Delta Flow by ChartPrime, Dynamic Supply and Demand Zones by AlgoAlpha and Zeiierman's all-in-one structure tool. They build zones in very different ways, from volume profiles to candle sequences to swing points, so the right pick depends on how you want a zone to be defined.
This guide explains what a supply and demand indicator should do, then walks through five well-known TradingView options and what each one does best. This article is published by ZynAlgo, so our own short section comes last. Script details were checked on each developer's official TradingView script page or website in November 2026. Prices are left out because they change often.
What a supply and demand indicator should do
A supply zone is a price area where selling pressure was strong enough to turn price down. A demand zone is the opposite: an area where buying pressure turned price up. Traders watch these areas for a reaction when price returns.
Drawing zones by hand is slow and inconsistent, and after a few days most charts are covered in boxes that never mattered. A good indicator solves that with clear rules. Before you pick one, check these five points:
- A stated zone rule. You should know exactly what creates a zone: a swing high or low, a run of strong candles, a volume cluster or a breakout from a base.
- A test and invalidation rule. The tool should tell you when a zone has been tested and when it is broken, usually on a candle close through it.
- A limit on clutter. Look for a cap on zones per side and protection against overlapping boxes.
- Some measure of strength. Volume, delta or a retest record helps you tell a heavy zone from a light one.
- Confirmed-bar behaviour. Zones and markers should be decided on closed candles, so the history you study matches what you would have seen live.
At a glance
| Indicator | Developer | How zones are built | Access |
|---|---|---|---|
| Supply and Demand Visible Range | LuxAlgo | Volume bins across the visible chart range | Open-source |
| Supply and Demand Zones | Flux Charts | Swing highs and lows, with retest and breakout tracking | Open-source |
| Supply & Demand: Cumulative Volume Delta Flow | ChartPrime | Base candle followed by a large ATR breakout, with delta inside each zone | Open-source |
| Dynamic Supply and Demand Zones | AlgoAlpha | Low-volume price bins between pivots | Open-source |
| Support & Resistance/Supply & Demand/Liquidity/Trendlines (Expo) | Zeiierman | Market structure, mapped with several other level types | Paid space |
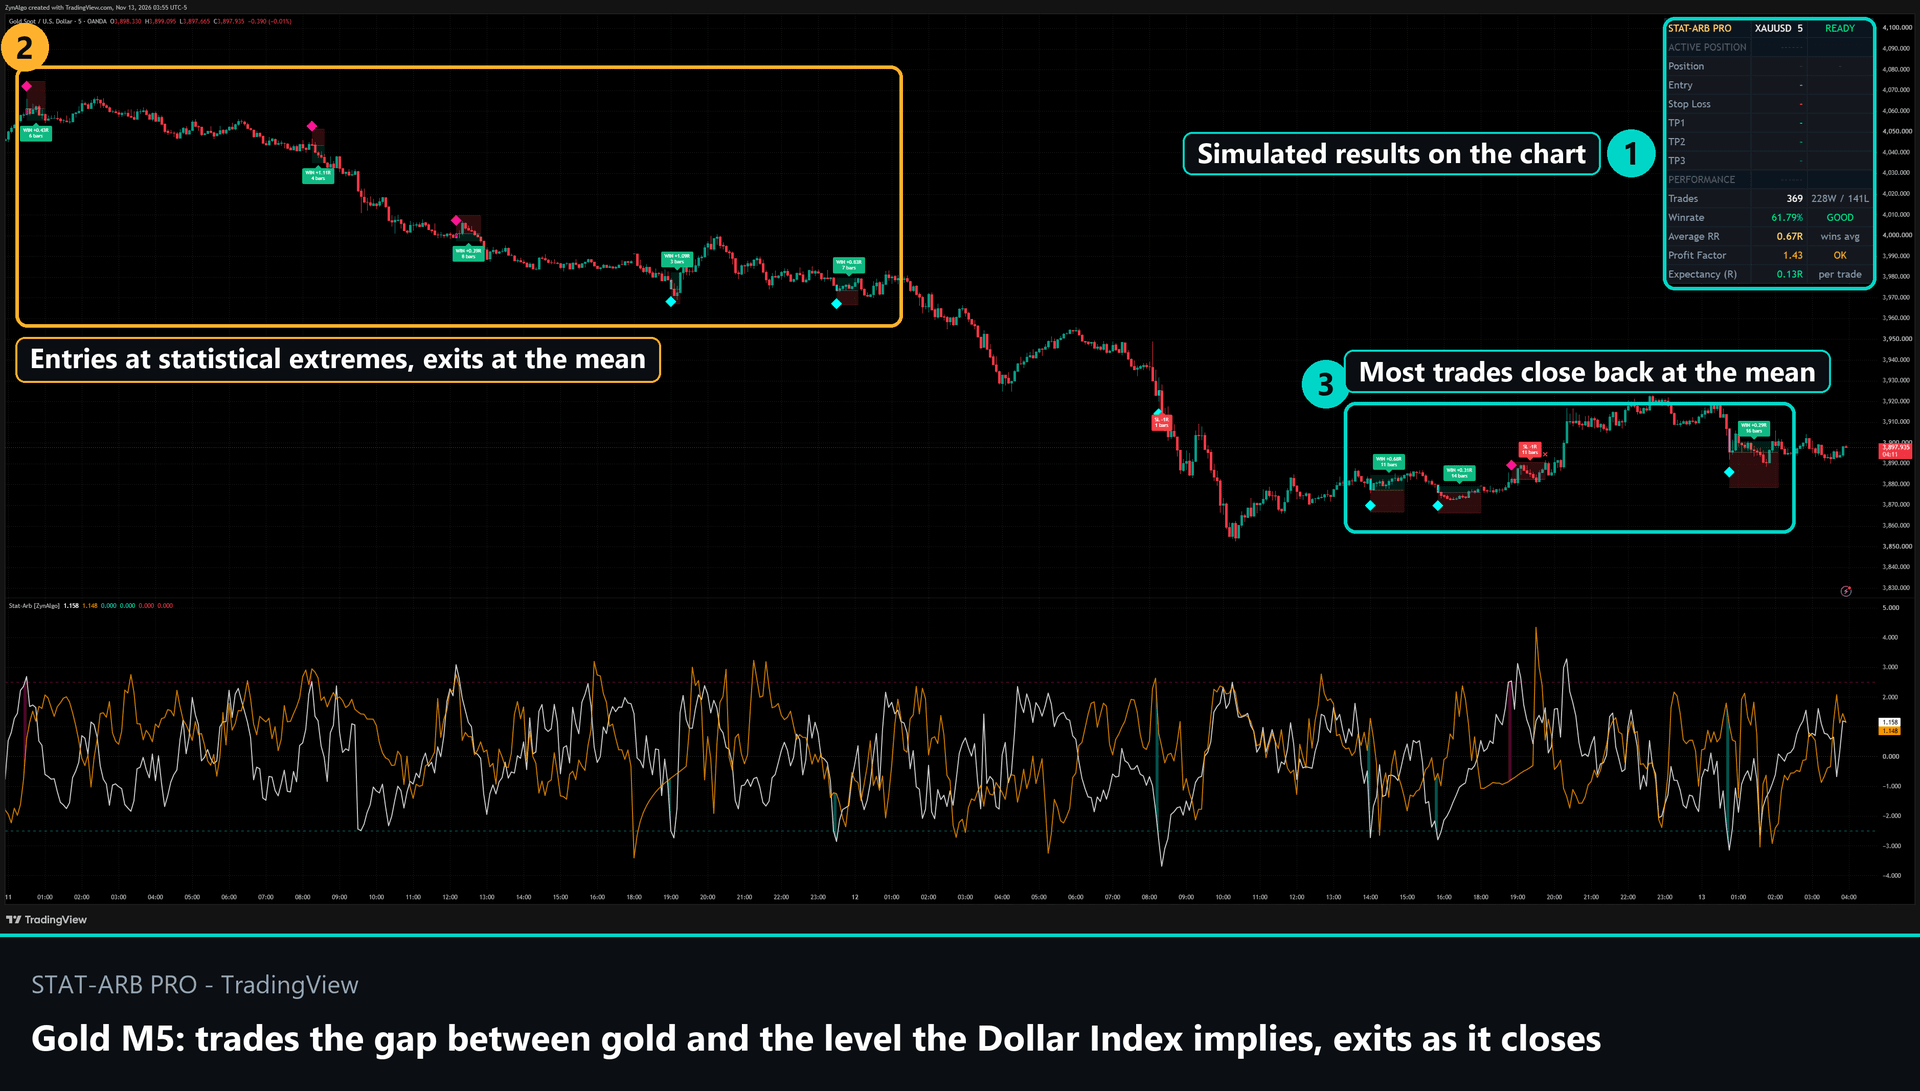
STAT-ARB Pro TDV
Trades gold's deviation from the level the Dollar Index implies and exits as the gap closes. Rolling regression spread, Auto preset for M5 and M15, closed-candle signals with a stop and a mean exit.

1. Supply and Demand Visible Range (LuxAlgo)
Supply and Demand Visible Range is an open-source script by LuxAlgo. It treats zones as a volume question rather than a candle pattern.
How it works: the script splits the price range of the bars on your screen into bins, similar to a volume profile. It adds volume from the top of the range down to form the supply area, and from the bottom up to form the demand area, stopping once a set share of the visible volume is reached. Intra-bar data is used to make the result more precise. Solid lines show each area's average, dashed lines show a volume-weighted average, and a central line sits between them.
Strengths:
- A simple, volume-based definition with only three main settings: Threshold %, Resolution and the intra-bar timeframe.
- Zones adapt to whatever range you are studying, which makes it a quick descriptive tool for any chart.
- LuxAlgo also publishes Supply and Demand Anchored, where you choose the start and end points yourself, for traders who want zones that stay fixed.
Good to know: because only on-screen bars are used, the zones change when you scroll or zoom. The author describes it as more suited to describing a range than to marking fixed levels.
Best for: traders who think in volume profiles and want the premium and discount ends of a range marked quickly.
2. Supply and Demand Zones (Flux Charts)
Supply and Demand Zones is a free, open-source script by Flux Charts. Its focus is keeping a record of how price has treated each zone.
How it works: a zone is drawn around a confirmed swing high or swing low. The outer edge sits at the swing extreme and the inner edge uses the average wick of nearby candles. Retests are checked on closed bars, and a breakout needs a second close through the zone before it counts, so a single bar that reverses does not flip the zone. A confirmed breakout flips the zone to the other side and keeps its history.
Strengths:
- A "Held" reading shows the share of retests that survived a set window without a breakout.
- Zones can be ranked by strongest or nearest, with five per side shown by default.
- Four alerts: bullish and bearish retest, bullish and bearish breakout, all on confirmed bars.
- For traders who want more, Flux Charts also offers a premium MTF Supply & Demand Zones Toolkit that identifies zones on up to three timeframes at once, plus a matching S&D Backtester and S&D Screener for up to 15 tickers.
Best for: traders who trade retests and want each zone's track record and alerts in one free script.
3. Supply & Demand: Cumulative Volume Delta Flow (ChartPrime)
Supply & Demand: Cumulative Volume Delta Flow is an open-source script by ChartPrime. It adds order-flow context inside every zone.
How it works: a demand zone forms when a bearish base candle is followed by a bullish breakout candle that is much larger than the recent ATR (average true range, a measure of typical candle size). Supply zones are the mirror case. Inside each active zone, the script draws a cumulative volume delta wave that tracks buying minus selling since the zone formed, and prints the value on the label. A zone is deleted as soon as price closes through it.
Strengths:
- A momentum filter (ATR length and multiplier) keeps only zones created by strong moves.
- The delta wave shows whether flow is supporting a zone while price sits in it, including possible absorption.
- Overlap filtering and a cap on active zones keep the chart clean.
Best for: traders who like the classic base-and-breakout zone and want to see order flow develop inside it.
4. Dynamic Supply and Demand Zones (AlgoAlpha)
Dynamic Supply and Demand Zones is an open-source script by AlgoAlpha. It looks for zones in a less common place: thin volume.
How it works: the script finds pivot highs and lows to set an analysis range, which can adjust automatically from the most recent pivot. It splits that range into price bins and marks a bin as a zone when its volume is lower than the bins next to it by a set tolerance. Zones are coloured green for bullish, red for bearish and grey for neutral levels.
Strengths:
- A different view of supply and demand, built from gaps in the volume distribution rather than from candle patterns.
- Dynamic or fixed look-back, adjustable resolution and zone tolerance.
- Optional volume profiles and background highlighting, plus alerts when new pivots are detected.
Best for: volume-profile traders who want a pivot-anchored map of thin and heavy areas.
5. Support & Resistance/Supply & Demand/Liquidity/Trendlines (Expo) (Zeiierman)
This Zeiierman tool is part of Zeiierman's paid space on TradingView. Instead of one zone type, it combines several level types in one script.
How it works: the script reads market structure in real time and maps support and resistance, supply and demand zones, liquidity zones, trendlines and key psychological levels. A later update added order blocks and trend-based support and resistance, and alerts.
Strengths:
- Several level types in a single script, so you do not need to stack separate tools.
- According to its release notes, all zone types can be displayed at the same time.
- From a developer with one of the longer publishing histories on TradingView.
Best for: traders who want one structure map rather than a dedicated supply and demand tool.
How to test a supply and demand indicator before you rely on it
- Pick one market and one timeframe. For example, an index future on the 15-minute chart.
- Use Bar Replay. Step through past sessions on TradingView and note when each zone appears. Confirm it appears on a closed bar and that it does not move afterwards.
- Count zones per session. If most zones are never revisited, tighten the settings or try a different zone rule.
- Check the invalidation rule. Find three zones price closed through and confirm each was removed or flipped as the description says.
- Read the volume source. Volume-based tools work best on markets with real volume, such as futures, indices and crypto. On spot forex, TradingView usually shows tick volume, so treat volume readings as a rough guide.
- Test one alert. Set it on a live chart and confirm it fires on the event you expect.
Common mistakes with supply and demand indicators
- Treating every zone as equal. Two boxes can look the same and carry very different amounts of volume or history.
- Resting orders inside every zone. Price often trades into a zone before it reacts, or straight through it. Many traders wait for a close back outside the zone.
- Keeping broken zones. A close through a zone usually ends its original meaning, though some traders watch it again as a flipped level.
- Stacking several zone tools. Overlapping boxes from different scripts make the chart harder to read. Choose one primary zone rule.
ZynAlgo supply and demand indicators
ZynAlgo also builds two supply and demand tools for TradingView. Both are mapping tools that leave the trade decision to you, and both have a full Description and Manual on their product pages.
- Core Supply & Demand TDV creates a zone only when a three-bar sequence forms on volume above its running average, then prints each zone's net volume and a Power reading from 1 to 10 that compares it with the other zones on the chart. Solid borders mark fresh zones, dashed borders mark tested ones, and a diamond prints only after a bar closes back outside the zone. We explain the idea behind ranking zones in Why Your Supply and Demand Zones All Look the Same.
- Order Barrier TDV promotes a confirmed swing pivot to a zone only when the directional volume behind it clears an adaptive threshold. Zone thickness follows long-term ATR, and the tool tracks each later touch as a defence or a clearance, so broken zones flip colour and can be read as role-reversal levels.
If you trade order blocks rather than broader zones, see our order block indicator checklist. You can also browse the free indicators or the full marketplace.
FAQ
What is the best supply and demand indicator for TradingView?
There is no single best tool for everyone. Well-known options include LuxAlgo's Supply and Demand Visible Range, Flux Charts' Supply and Demand Zones, ChartPrime's Cumulative Volume Delta Flow and AlgoAlpha's Dynamic Supply and Demand Zones. The best one for you uses a zone rule you understand, removes broken zones on a close, limits clutter and works on confirmed bars.
Are there free supply and demand indicators on TradingView?
Yes. The LuxAlgo, Flux Charts, ChartPrime and AlgoAlpha scripts in this list are open-source and can be added from their TradingView script pages.
What is the difference between supply and demand zones and support and resistance?
Support and resistance are usually drawn as lines at prices where the market turned. Supply and demand zones are areas with thickness, built from the move that left them. In practice the ideas overlap; what matters is the indicator's exact rule.
Do supply and demand indicators repaint?
It depends on the design. Zones built from confirmed swings or closed bars do not change once drawn, although they appear a few bars after the swing. Tools that recalculate from the visible range, such as volume-profile style zones, change when you scroll or zoom by design. Read each script's description and check with Bar Replay.
Do supply and demand zones work on forex?
The price logic works on any market. Volume-based strength readings are more reliable on markets with real volume, such as futures, indices and crypto, because spot forex on TradingView usually reports tick volume.
Trading involves risk; indicators support decisions, they do not guarantee results.
STAT-ARB Pro TDV
Trades gold's deviation from the level the Dollar Index implies and exits as the gap closes. Rolling regression spread, Auto preset for M5 and M15, closed-candle signals with a stop and a mean exit.