
A Dual Trailing Stop Pullback Entry Indicator for Trend Traders
The pullback keeps taking your stop before the trend resumes
You see a clean breakout, you get in, and two bars later price dips back against you just far enough to tag your stop. Then it turns and runs the way you originally thought, without you in it. Or the opposite happens: you wait for a pullback to confirm before entering, and by the time you are convinced, the move has already gone.
Both problems come from the same source. A single trailing stop has to make one line do two jobs: define the trend and react to short-term noise. Set it tight and every wiggle stops you out. Set it wide and you give back most of the move before it protects you at all.
What a dual trailing stop pullback entry indicator actually does
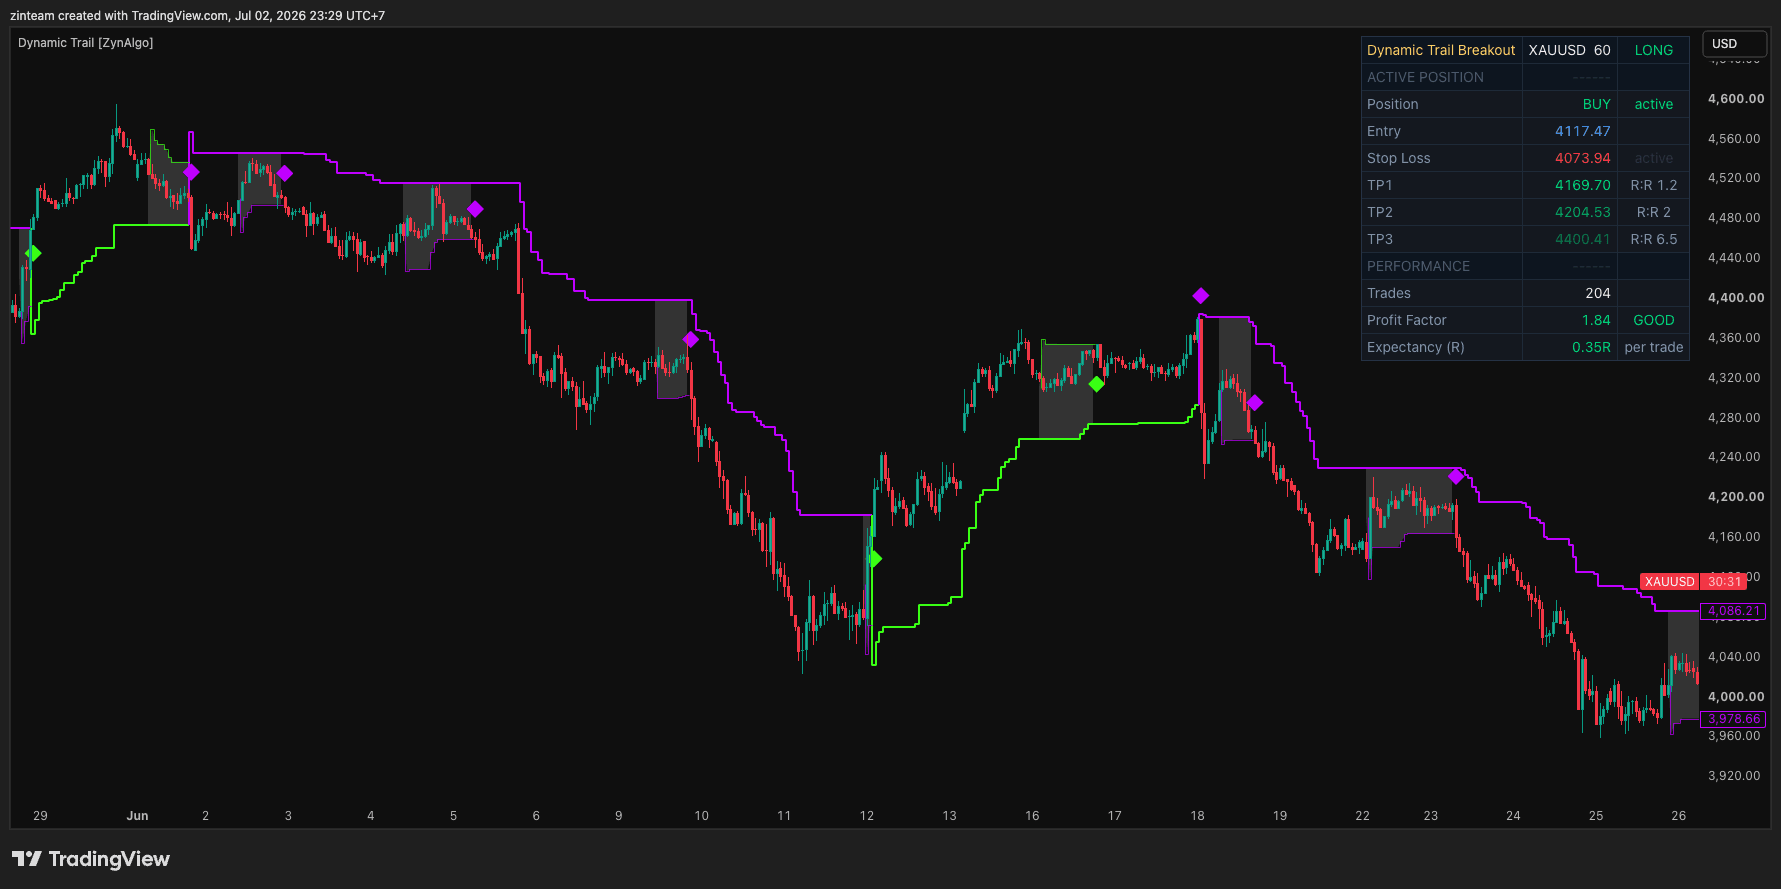
Dynamic Trail Breakout Pro (ZynAlgo) runs two trailing stops on the same chart instead of one. A slow trail holds its ground through ordinary noise and defines which way the trend is pointing. A faster trail tracks the shorter swings inside that trend. Most of the time the two agree and the fast trail stays off the chart, so you are just looking at a clean trend line.
When the fast trail flips against the slow trail while price still holds the slow trail, that disagreement is a pullback, and the space between the two lines is shaded as a pullback cloud. The cloud does not fire a signal on its own. It marks the dip while it is still forming, so you are watching it rather than reacting to it after the fact. A re-entry diamond only prints once the fast trail flips back into agreement with the slow trail, and an optional volume filter checks that the breakout bar carrying it traded above its recent average volume before the signal is allowed to print.
How it plays out in a real session
Picture a trending instrument on an intraday chart. The slow trail is holding an uptrend. Price rolls over for a handful of bars, the fast trail flips down, and the pullback cloud appears between the two lines. You are not looking for a reason to enter yet; you are watching whether price holds above the slow trail while the cloud is showing.
A few bars later the bar that snaps back above the fast trail also carries above-average volume, the fast trail flips back up, and a bullish diamond prints below that bar. The tool has already worked out the entry reference from the close of that bar, placed a protective stop at an ATR-scaled distance, and projected up to three targets at your chosen risk-to-reward ratios, with a break-even shift after the first target. If the trade never resolves, it times out automatically after a set number of bars instead of sitting open indefinitely. A dashboard tracks the live position and how the current settings have behaved on that chart, so you can see the state at a glance rather than re-deriving it from the raw lines.
Dynamic Trail Breakout Pro TDV
Identify pullbacks inside trends with dual trailing lines and mark re-entries on volume confirmation with projected entry, stop and targets for TradingView.

Who this fits
- Traders who would rather add to an established trend on a pullback than chase the first push.
- Traders who frame risk from the setup itself and want the stop distance and targets measured before they commit, not eyeballed after entry.
- Traders who find a single trailing stop whipsaws them, and want one stable read on the trend separated from a faster read on the pullback.
- Intraday traders who want signals restricted to a chosen session window, since that filter is optional and off by default.
What it does not do
Dynamic Trail Breakout Pro does not predict how deep a pullback will go or whether it will resolve back into the trend at all. It reacts to what has already happened on the chart: the fast trail flipping, price holding the slow trail, volume clearing its average. In a market that is chopping sideways with no clear slow-trail direction, the pullback cloud can appear and disappear repeatedly without ever producing a clean re-entry, and in a market gapping through both trails at once the tool has nothing useful to say until the dust settles. It does not select your instrument or timeframe for you, and the dashboard's Profit Factor and Expectancy figures describe how the current settings have behaved on that specific chart and history, not a forecast of what they will do next. It is a charting and signal tool, not a trade execution or portfolio system.
Trading involves risk, including the risk of loss beyond what any indicator can prevent. Nothing here is investment advice, and past behaviour shown on a chart does not predict future performance. Always trade with your own plan and position sizing.
Pairing it with the rest of your chart
If you want more context on the levels a pullback is pulling back into, Core Supply & Demand ranks supply and demand zones by the volume that built them, which gives you a sense of what kind of area the fast trail is reacting near. If you want a second, independent read on participation beyond the built-in volume filter, Volume Deviation Bands measures how far price has stretched from its volume-weighted mean, in the market's own units. Neither is required to use Dynamic Trail Breakout Pro; they simply add separate context to the same chart.
If the idea of separating trend from pullback with two trailing stops instead of one matches how you already think about entries, the product page has the full rundown of inputs and the dashboard.
Dynamic Trail Breakout Pro TDV
Identify pullbacks inside trends with dual trailing lines and mark re-entries on volume confirmation with projected entry, stop and targets for TradingView.